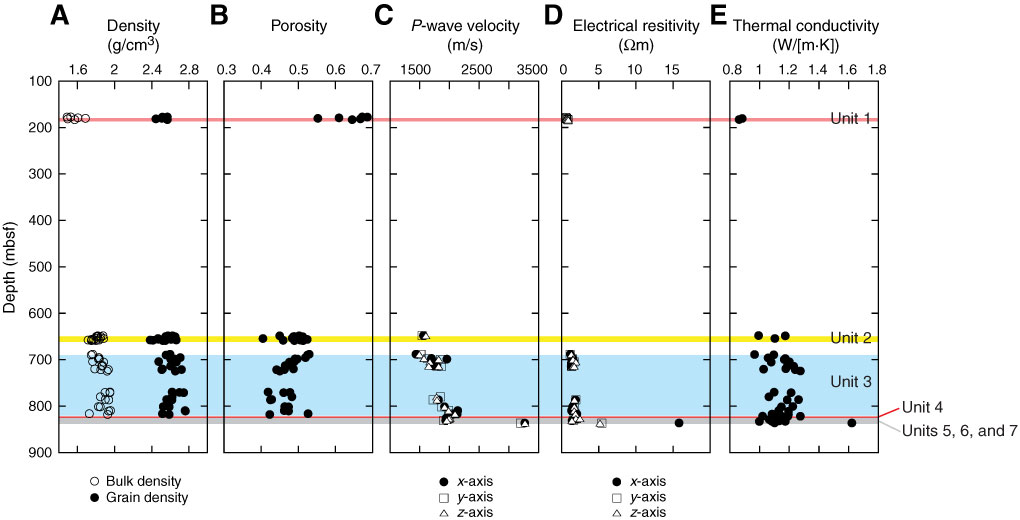
Figure F50. Plots of (A) bulk and grain density and (B) porosity on discrete samples, determined from MAD measurements, Hole C0019E. (C) P-wave velocity and (D) electrical resistivity measurements on discrete cube samples in x-, y-, and z-directions of the core reference frame. E. Thermal conductivity measurement results.

Previous | Close | Next | Top of page