Previous | Close | Next
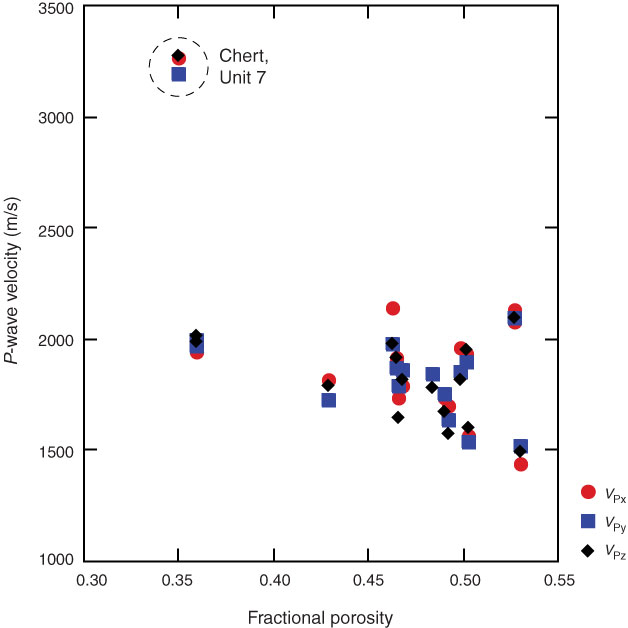
Figure F52. Plot of P-wave velocity as a function of porosity for discrete samples, Hole C0019E.
Previous | Close | Next | Top of page