Previous | Close | Next
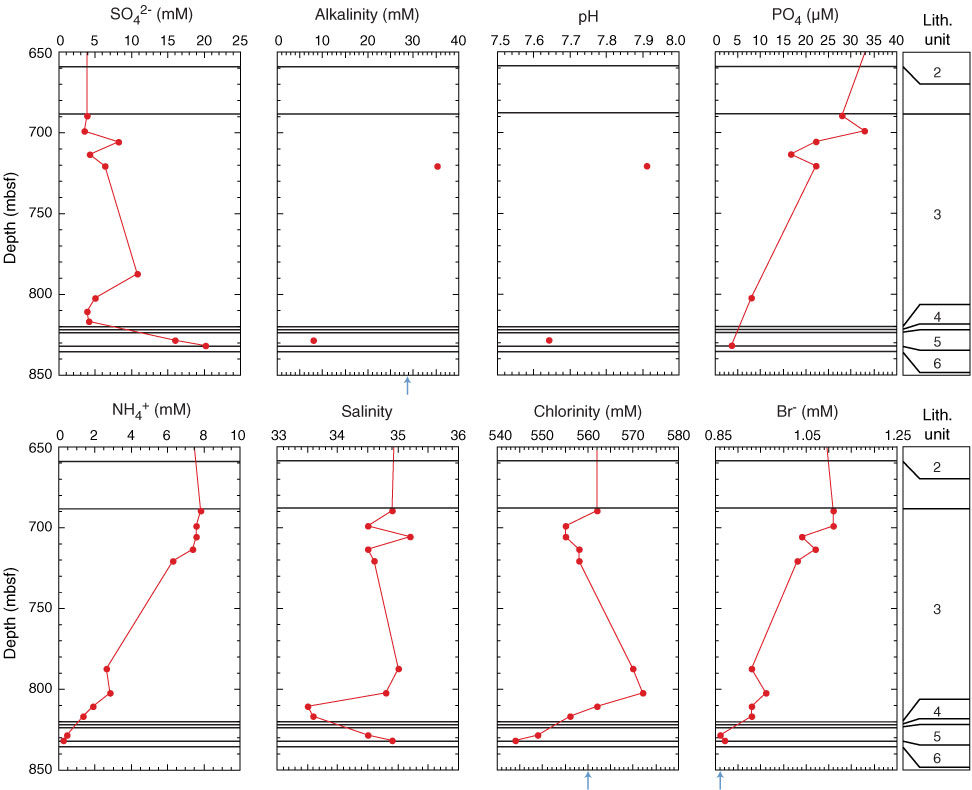
Figure F58. Plots of depth profiles of sulfate, alkalinity, pH, phosphate, ammonium, salinity, chlorinity, and bromide. Plots represent data summarized in Table T10. Arrows = seawater value.
Previous | Close | Next | Top of page