Previous | Close | Next
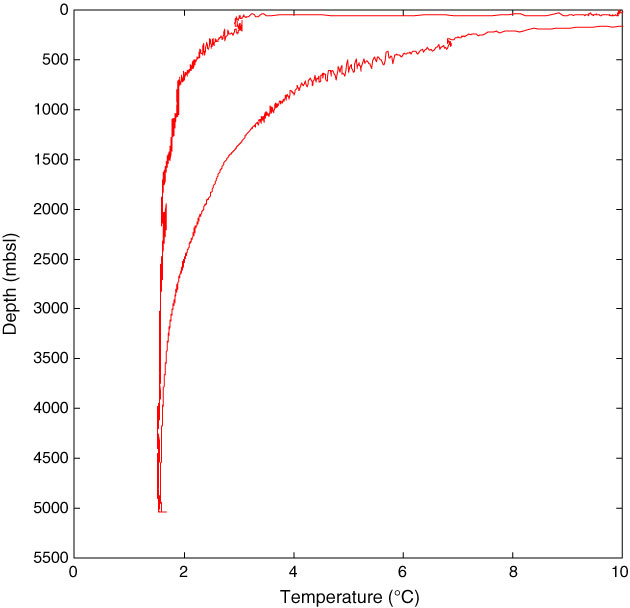
Figure F65. Plot of recorded temperature data as a function of depth during Run 1, Hole C0019E.
Previous | Close | Next | Top of page