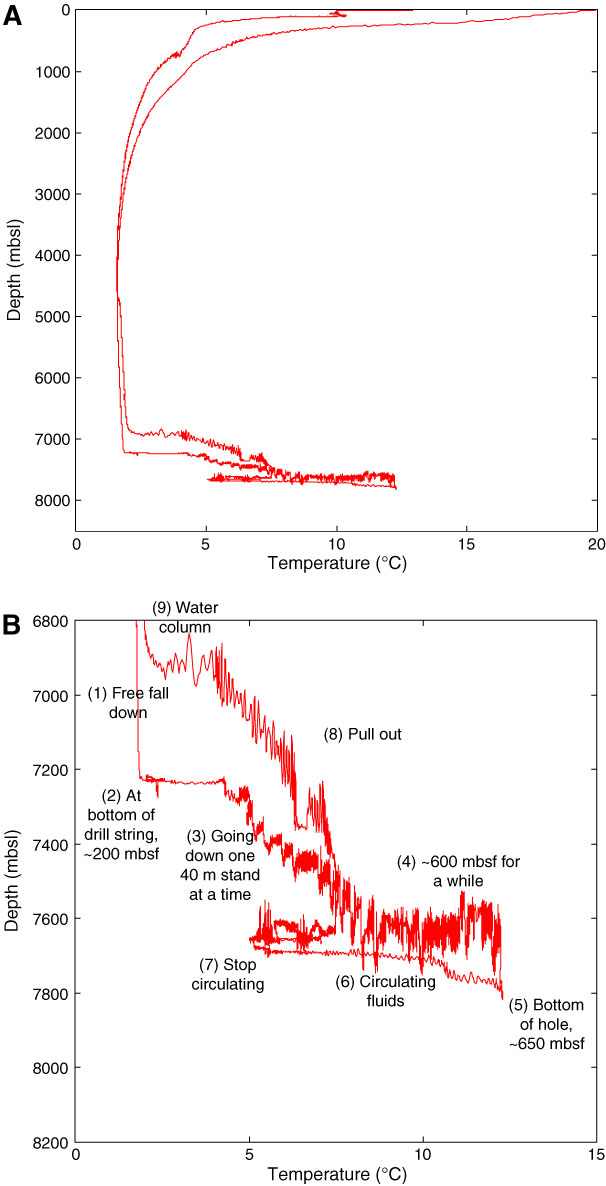
Figure F67. Plots of recorded temperature data as a function of depth during free-fall MTL Run 2, Hole C0019E. A. Data recorded in both the water column and subseafloor. B. Zoomed in version of A highlighting the temperature data as a function of depth during free-fall MTL Run 2 when the instrument was below seafloor. The figure is annotated to show how temperature changes correspond to other operations listed numerically in order of occurrence.
Previous | Close | Next | Top of page