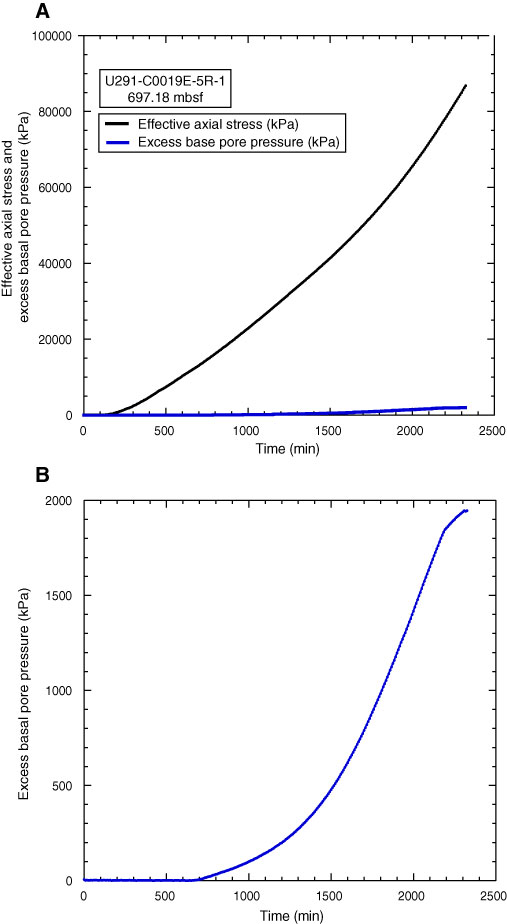
Figure F5. Time series data for Test U291 on prism sample (Section 343-C0019E-5R-1). A. Effective axial stress (black) and excess basal pore pressure (blue). The excess basal pore pressure remained <12% of the effective axial stress (e.g., ASTM International, 2006). B. Excess basal pore pressure.
Previous | Close | Next | Top of page