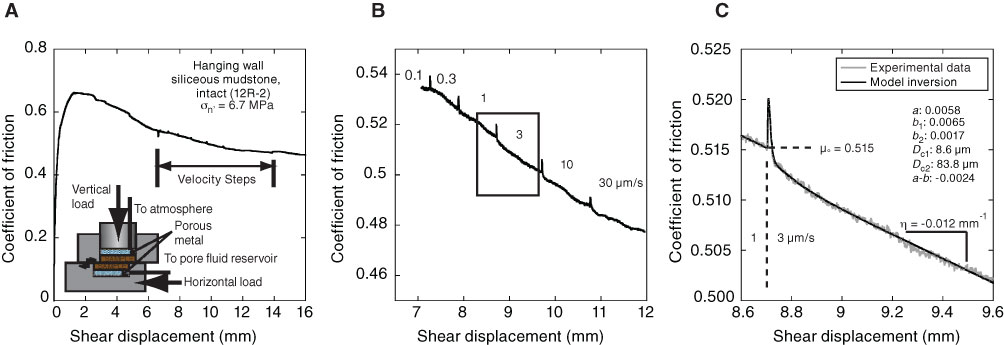
Figure F3. Example friction data for intact Sample 343-C0019E-12R-2. A. Complete friction-displacement curve showing where the velocity-stepping sequence was performed. Inset shows a schematic diagram of the single-direct-shear apparatus. B. Velocity-stepping sequence in A. C. Close-up view of the velocity step from 1 to 3 µm/s (box in B). Experimental data (gray) is overlain by data determined by inverse modeling (black).
Previous | Close | Next | Top of page