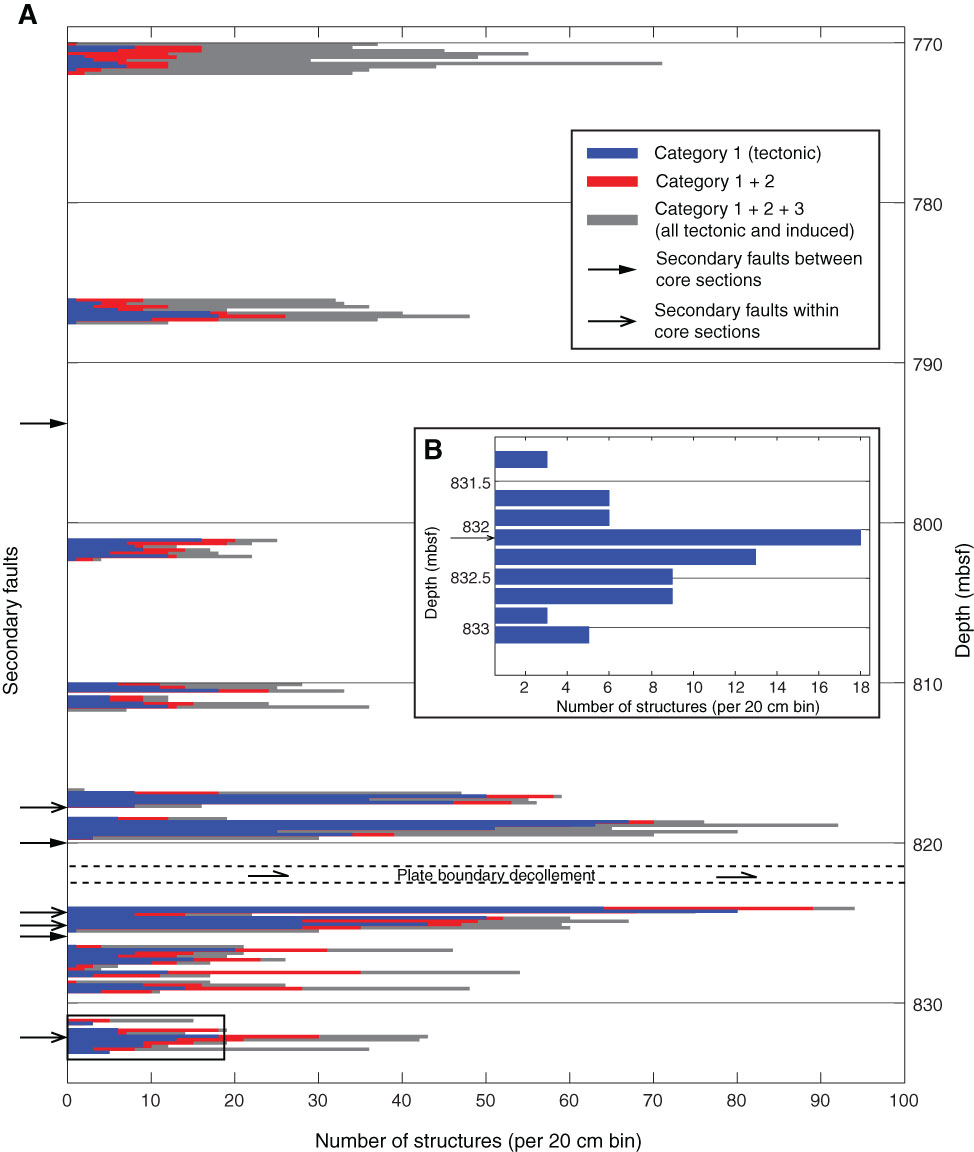
Figure F4. A. Number of structures (per 20 cm bin). Arrows = depths of known secondary faults, most of which are not resolvable from tectonic structure density data. B. Detail of the location of the secondary fault identified from chemostratigraphy showing the corresponding structure density data. A small increase in tectonic structure density is centered on the secondary fault.
Previous | Close | Top of page