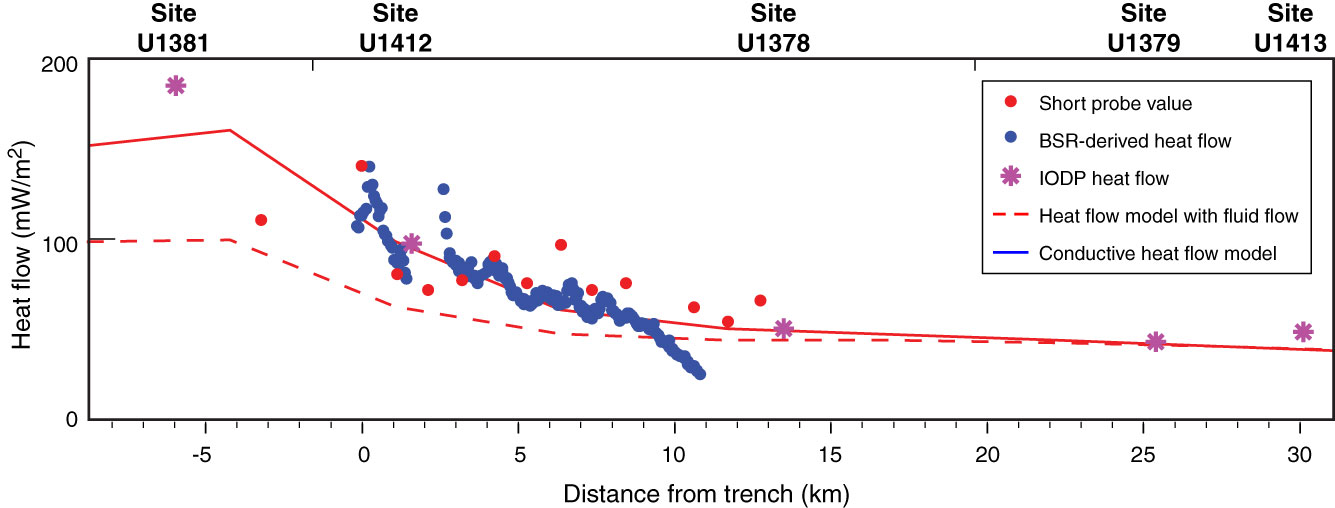
Figure F7. Heat flow and thermal models along seismic reflection Line BGR99-7, with Expedition 334 and 344 sites marked. Red solid circles show seafloor probe observations of heat flow, and blue circles show heat flow derived from bottom-simulating reflectors (BSRs) (Harris et al., 2010a). Red lines correspond to heat flow predictions based on two-dimensional thermal models described in Harris et al. (2010b). The dashed line corresponds to a subducting plate with no upper crustal fluid flow. The solid line corresponds to a subducting plate that incorporates upper crustal fluid flow.

Previous | Close | Next | Top of page