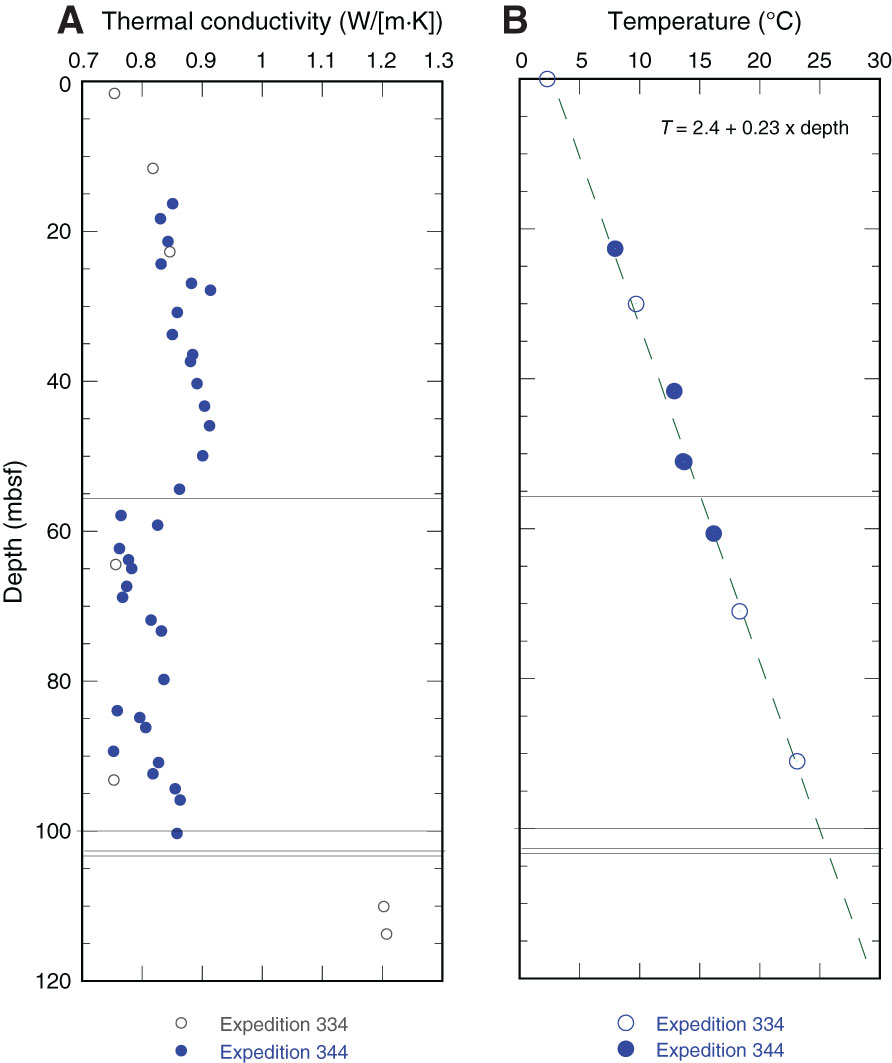
Figure F31. Thermal data, Site U1381. A. Thermal conductivity values. B. Equilibrium temperatures. Dashed line = temperature gradient, based on a least-squares fit to the combined data. Horizontal lines = lithostratigraphic unit boundaries.
Previous | Close | Next | Top of page