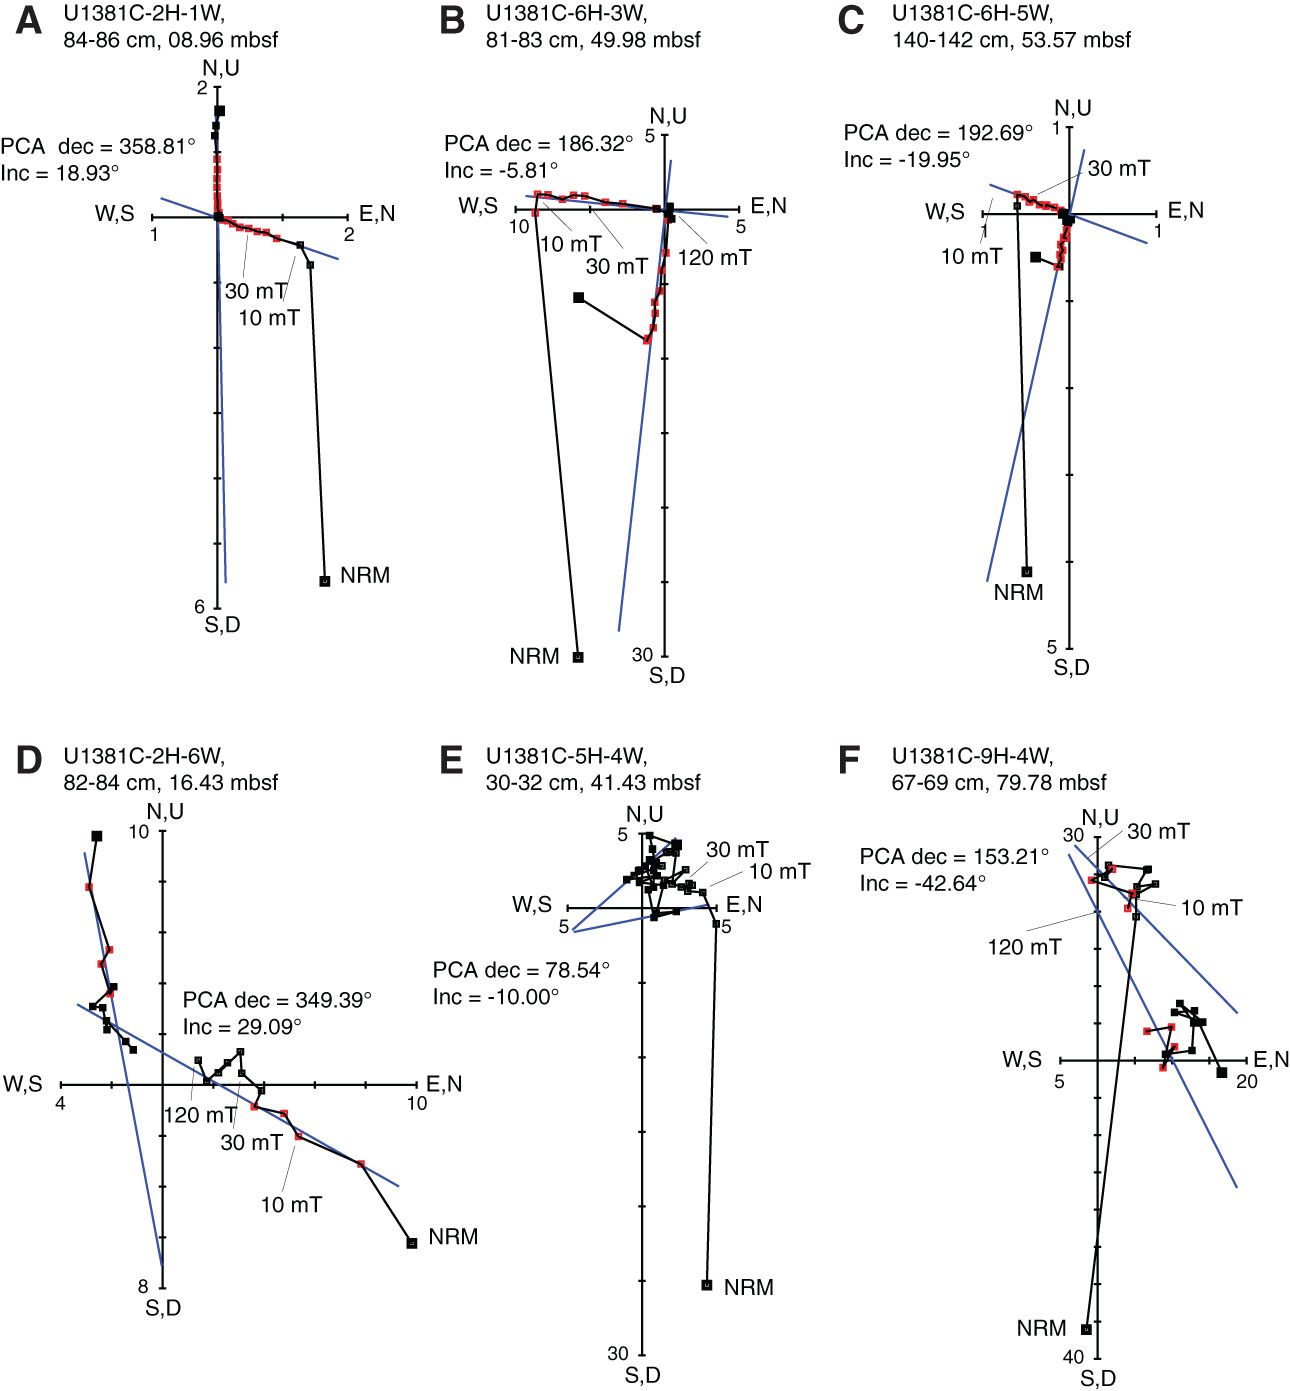
Figure F36. Representative vector end-point diagrams (Zijderveld, 1967) for sediment samples through stepwise AF demagnetization, Hole U1381C. All samples display a normal vertical component of magnetization caused by drilling that is removed after 5 mT demagnetization. Open and solid squares = projection of the magnetization vector end-points onto the vertical and horizontal planes, respectively. Blue lines = ChRM component derived by principal component analysis (PCA; Kirschvink, 1980). NRM = natural remanent magnetization. A–C. A stable component decays toward the origin of the vector plot. D–F. Less stable demagnetization behavior: negative inclinations, but declinations are still northerly.
Previous | Close | Next | Top of page