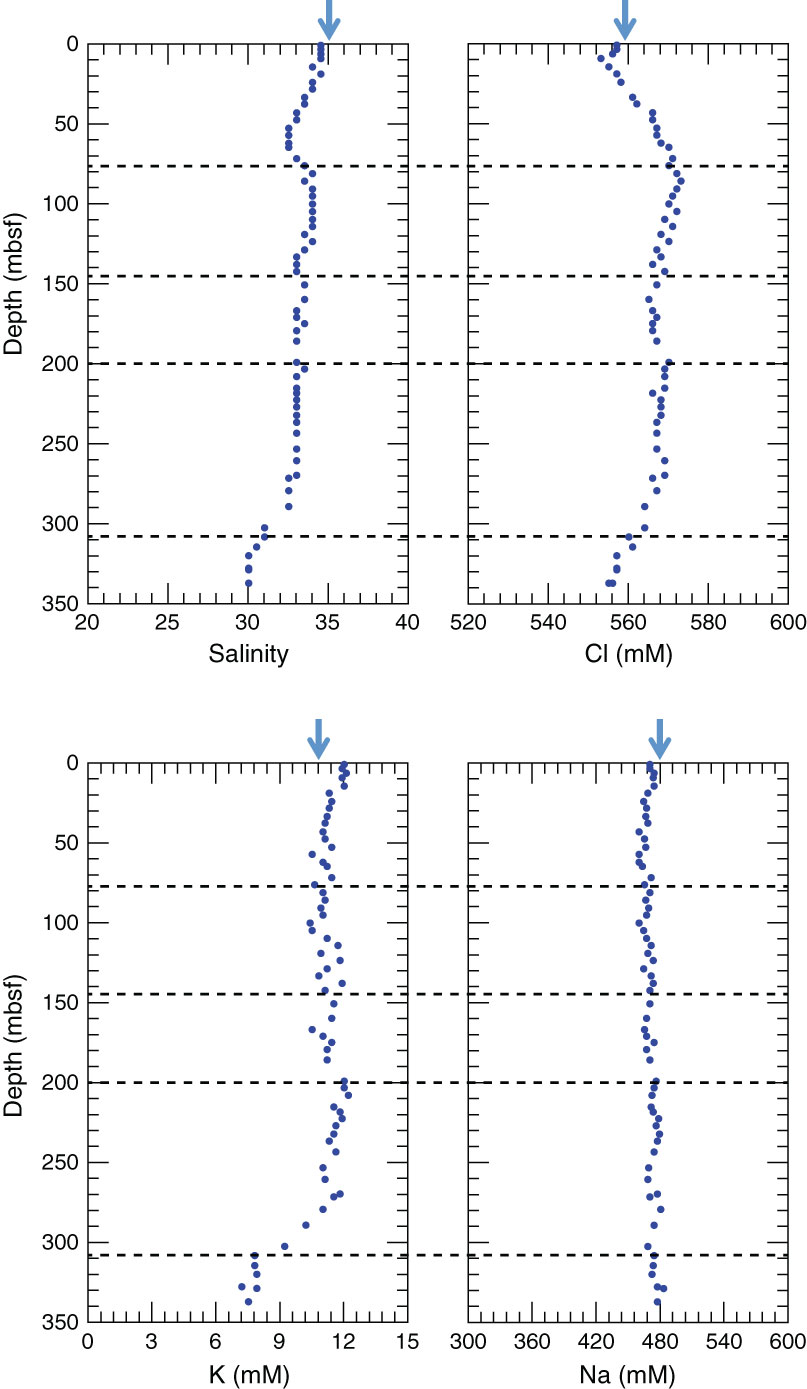
Figure F29. Downhole profiles for salinity, chloride, potassium, and sodium, Site U1414. Blue arrows = bottom seawater values. Dashed lines = lithostratigraphic unit and subunit boundaries IA, IB, IIA, IIB, and III.
Previous | Close | Next | Top of page