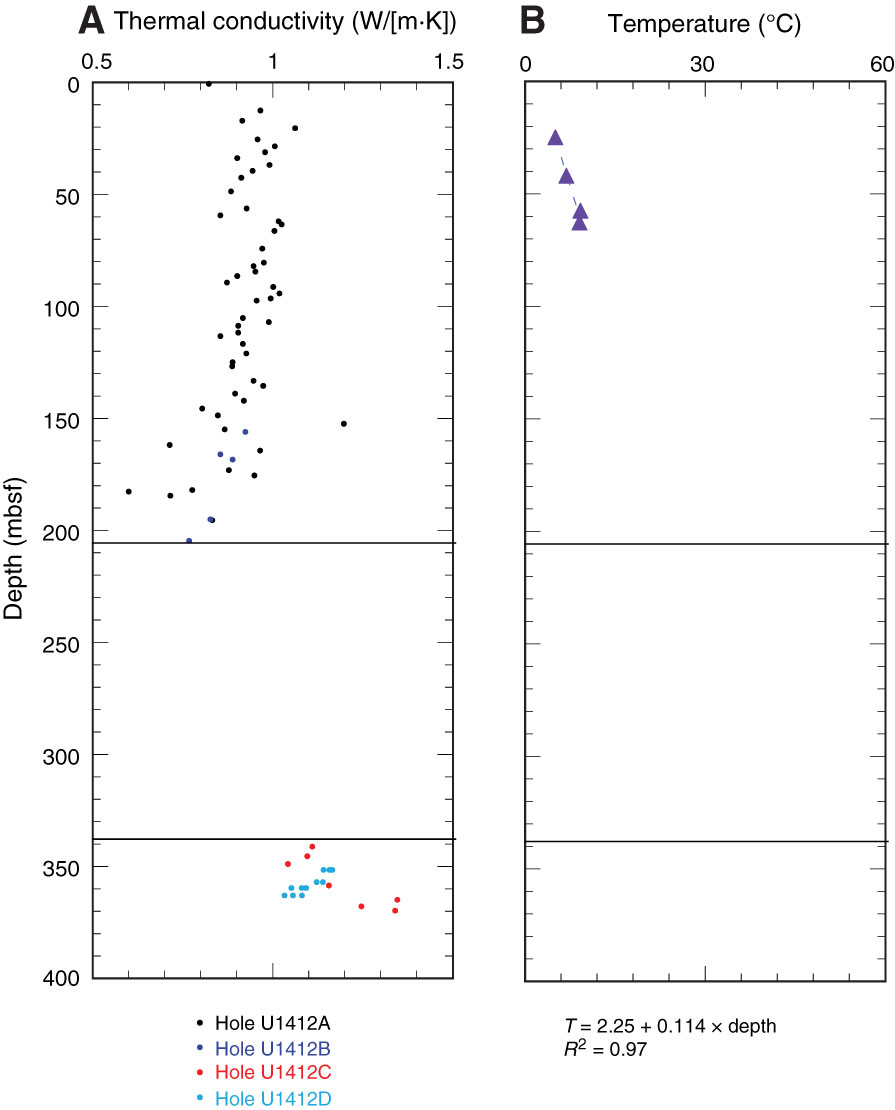
Figure F28. Thermal data, Site U1412. A. Thermal conductivity values. B. Equilibrium temperatures from Hole U1412A. Dashed line/equation = best linear fit to the temperature data. Horizontal lines = lithostratigraphic unit boundaries.
Previous | Close | Next | Top of page