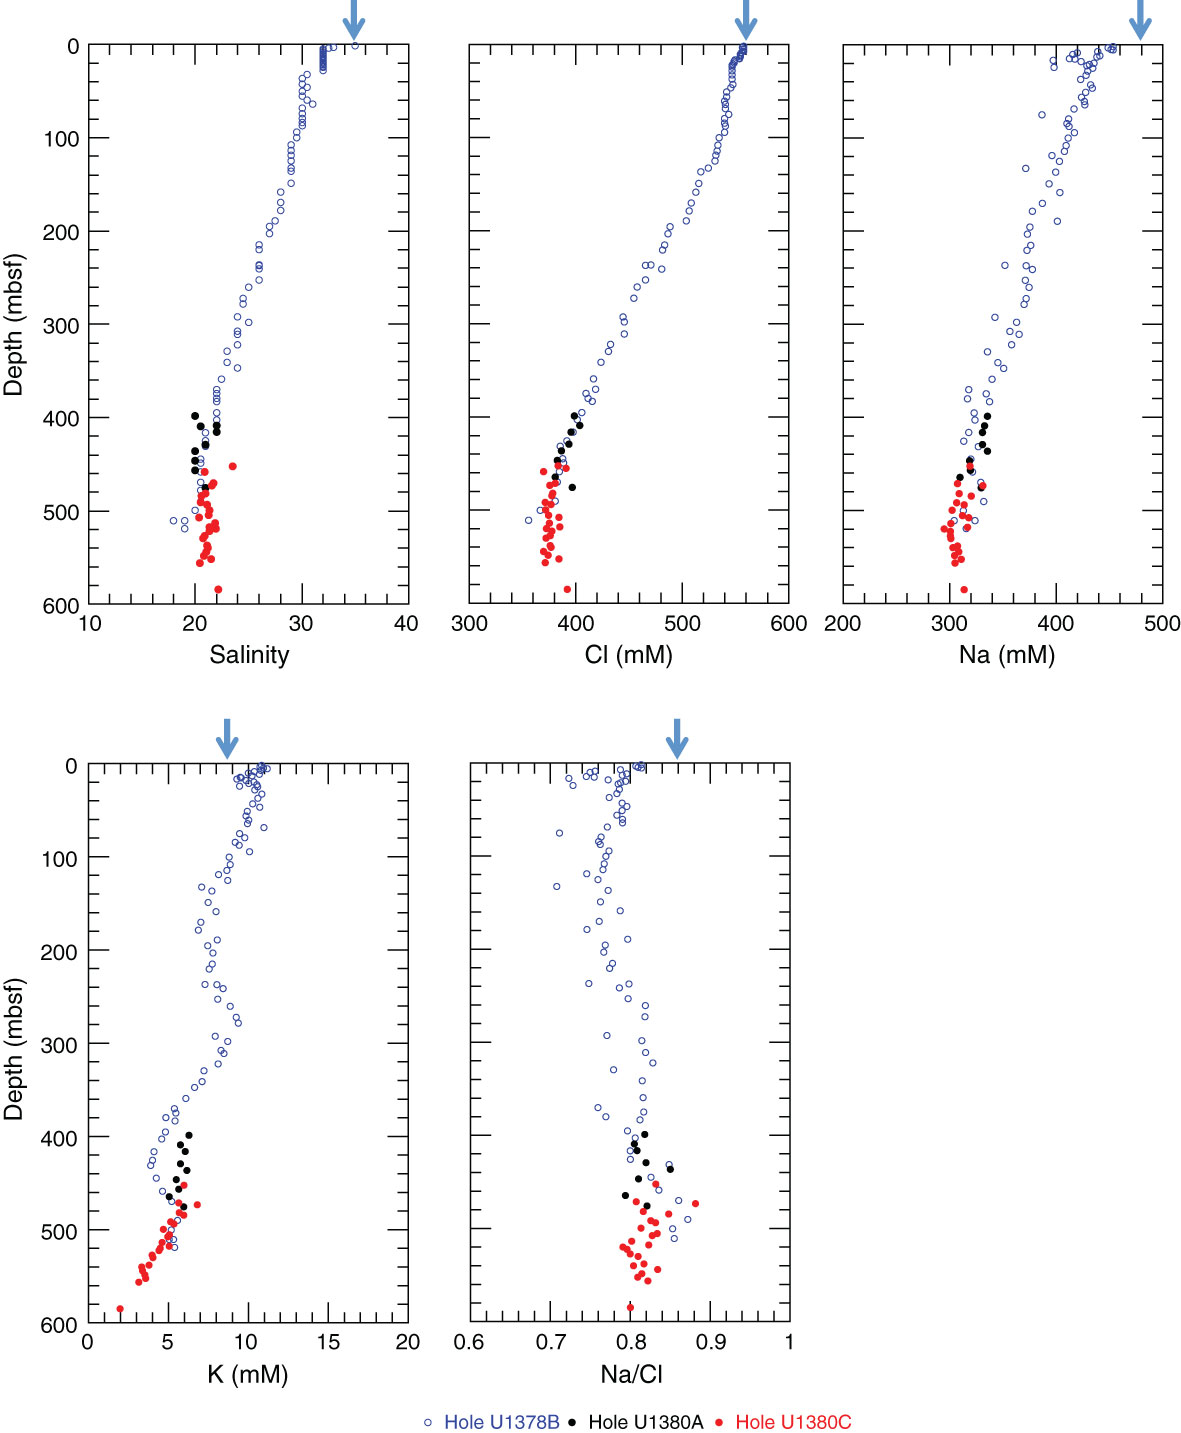
Figure F18. Downhole profiles of salinity, chloride, sodium, potassium, and sodium/chloride ratio, Hole U1380C. Data collected in Holes U1378B and U1380A during Expedition 334 (Expedition 334 Scientists, 2012a, 2012c) are shown for comparison. Blue arrows = bottom seawater values.
Previous | Close | Next | Top of page