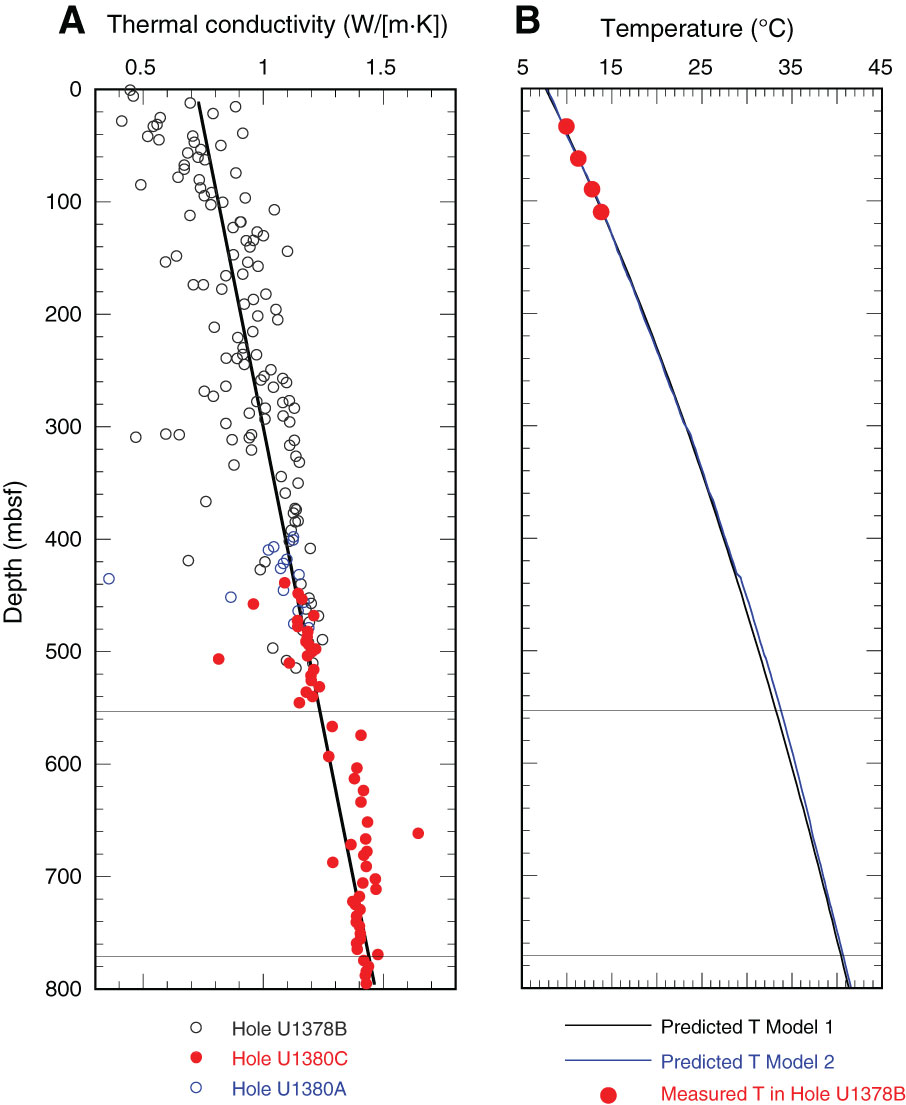
Figure F29. Thermal data, Sites U1380 and U1378. A. Thermal conductivity showing best-fit line (TC = 0.72 + 0.00093x; R = 0.88). B. Equilibrium temperatures. Estimated temperature based on linear fit to thermal conductivity (T) or precise thermal conductivity value (T2) with equilibrium temperature. Horizontal lines = lithostratigraphic unit boundaries.
Previous | Close | Next | Top of page