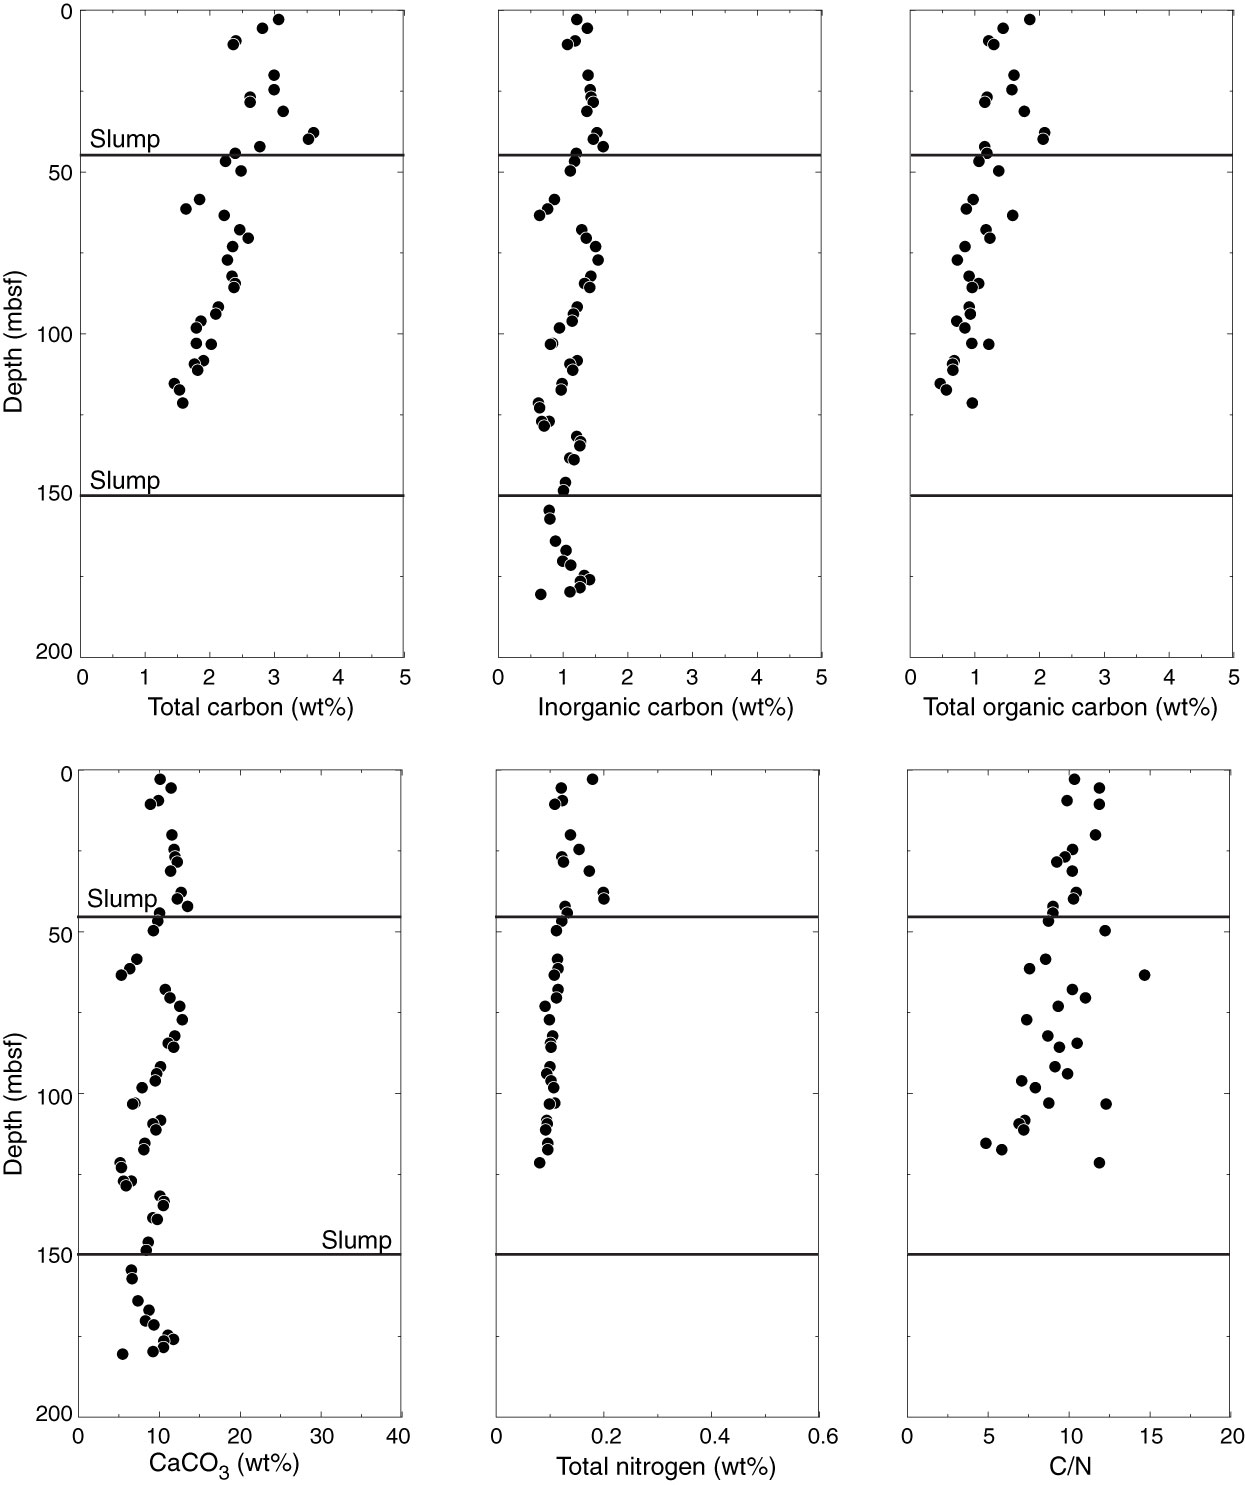
Figure F24. Downhole profiles of total carbon, inorganic carbon, total organic carbon, CaCO3, total nitrogen, and C/N ratio, Holes U1413A and U1413B. Solid lines denote the depths of sediment slumps. Note that the slump at 44.6 mbsf also corresponds to the boundary between lithostratigraphic Units I and II.
Previous | Close | Next | Top of page