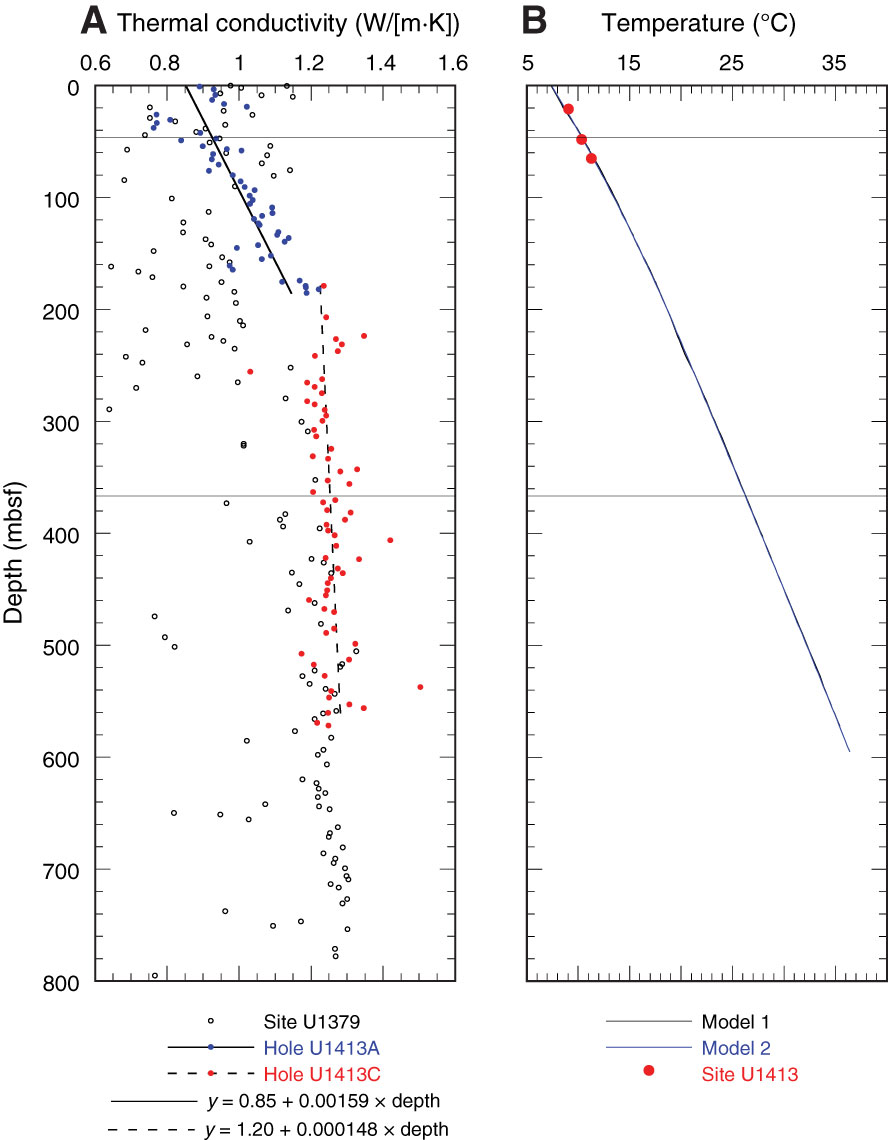
Figure F30. Thermal data, Sites U1379 and U1413. A. Thermal conductivity values showing best-fit line segments. B. Equilibrium temperatures (circles). Model 1 = estimated temperature based on two linear segments fitted to thermal conductivity, Model 2 = estimated temperatures based on measured thermal conductivity values. Horizontal lines = lithostratigraphic unit boundaries.
Previous | Close | Next | Top of page