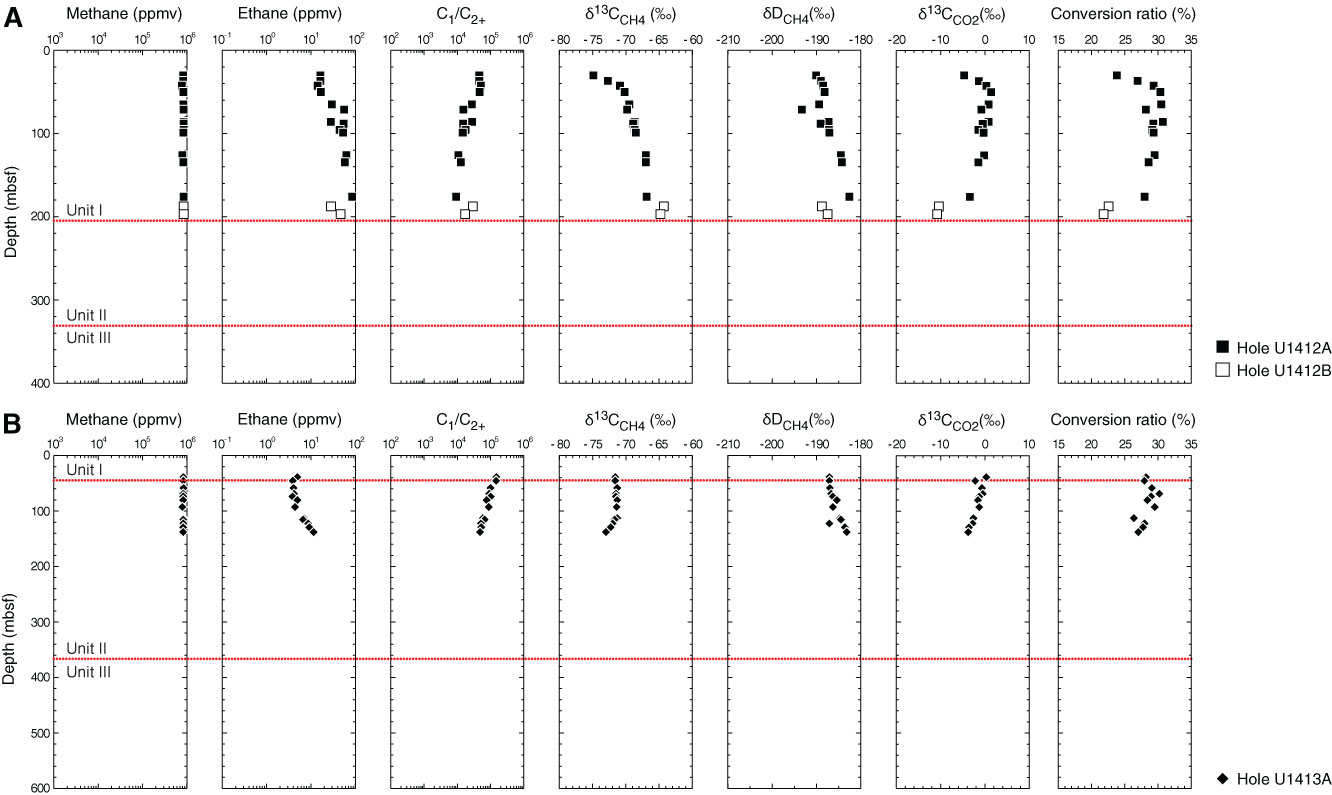
Figure F3. Downcore profiles of methane and ethane concentration, C1/C2+ ratios, isotopic compositions (δ13CCH4, δDCH4, and δ13CCO2), and conversion ratio in void gas at (A) Site U1412 and (B) Site U1413. Red dashed lines represent lithostratigraphic unit boundaries. Methane and ethane concentration and C1/C2+ ratios are onboard data.
Previous | Close | Next | Top of page