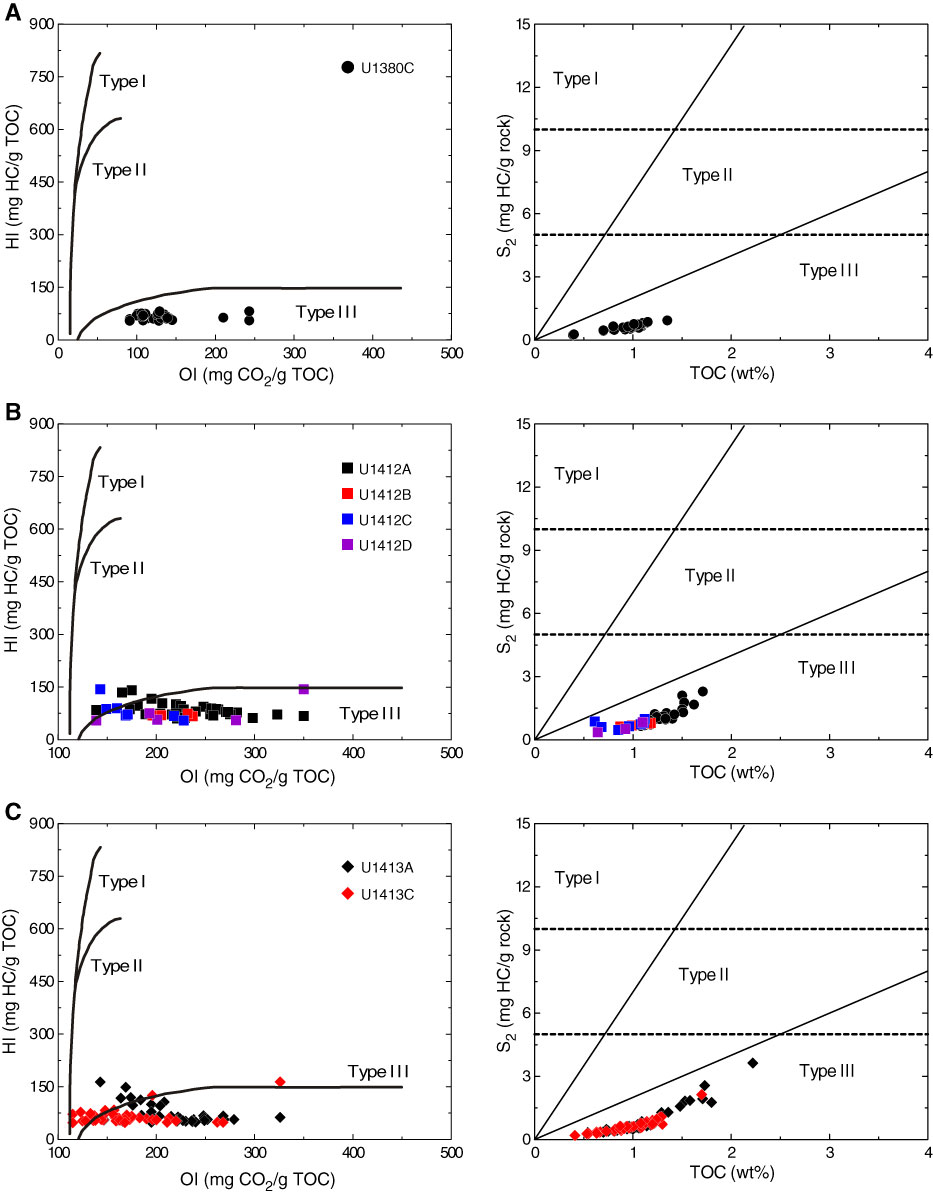
Figure F5. Modified van Krevelen–type diagrams of hydrogen index (HI) versus oxygen index (OI) and crossplots of second pyrogram temperature peak (S2) and total organic carbon (TOC). Type I = lacustrine algae, Type II = marine algae, Type III = vascular plants. A. Site U1380. B. Site U1412. C. Site U1413. (Continued on next page.)
Previous | Close | Next | Top of page