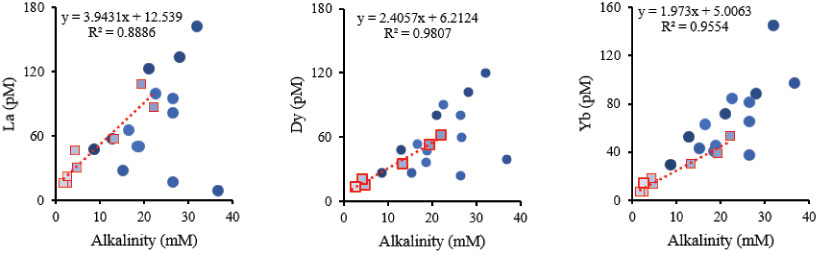
Figure F3. Correlations between pore fluid REE concentrations and alkalinity, Sites U1378/U1380. Color and shading patterns correlate with depth profile shown in Figure F2. Square symbols = samples from deeper than 200 mbsf, dotted line = linear regression for samples deeper than 200 mbsf.
Previous | Close | Next | Top of page