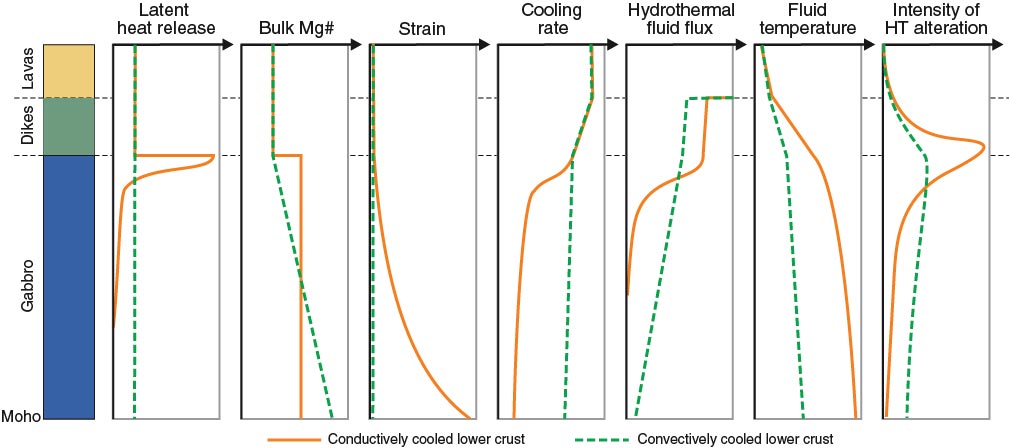
Figure F3. Schematic representation of the predictions of the general depth trends of latent heat release, bulk Mg#, strain, cooling rate, hydrothermal fluid flux, fluid temperature, and intensity of high-temperature (HT) alteration for the end-member “gabbro glacier” (with mainly conductive cooling of the lower crust) and “sheeted sill” (with convective cooling of the lower crust) models (Teagle, Ildefonse, Blum, and the Expedition 335 Scientists, 2012; original figure by R. Coggon).

Previous | Close | Next | Top of page