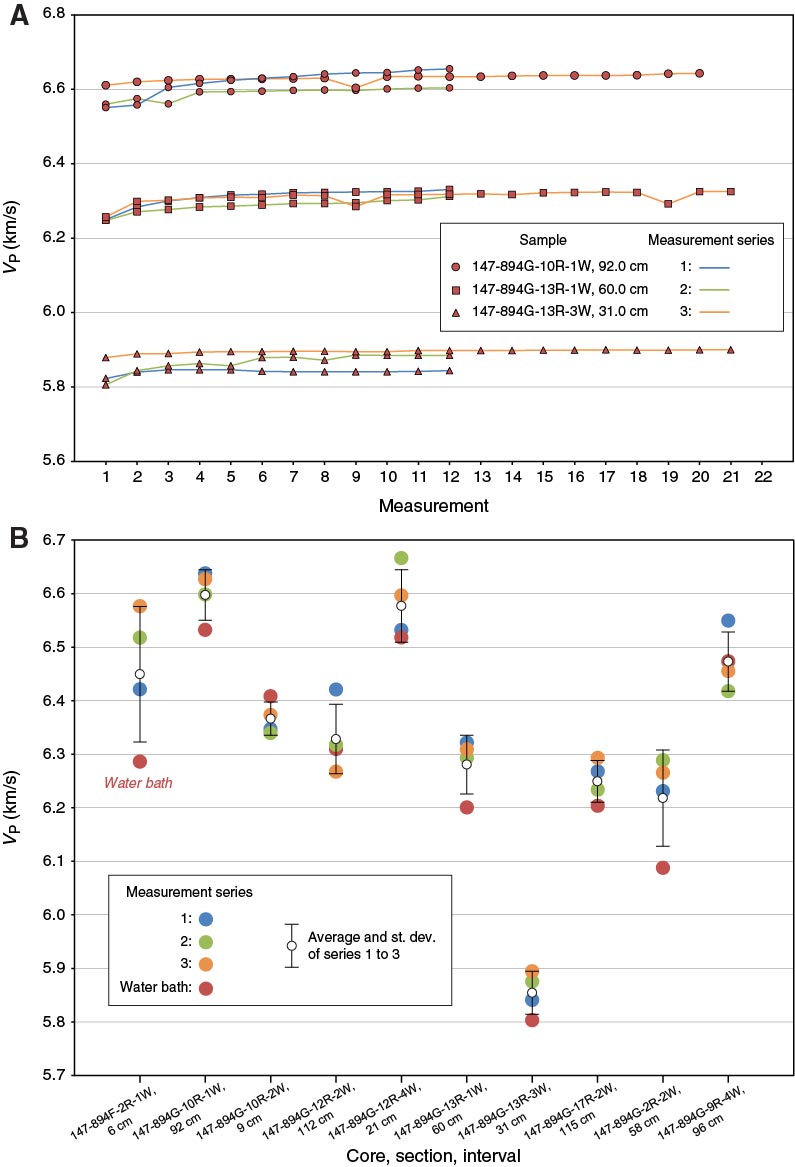
Figure F23. P-wave velocity (VP) measurements made during Expedition 345 using minicores from Ocean Drilling Program Leg 147 Site 894 gabbroic samples. A. Measurement series on three samples. B. Averages of three measurement series on the 10 Site 894 samples compared with a series of measurements on the same samples using the water bath. White circles and associated bars are the averages and standard deviation (st. dev.), respectively, of the measurements without the water bath. Averages do not take into account the first four measurements of each series.
Previous | Close | Next | Top of page