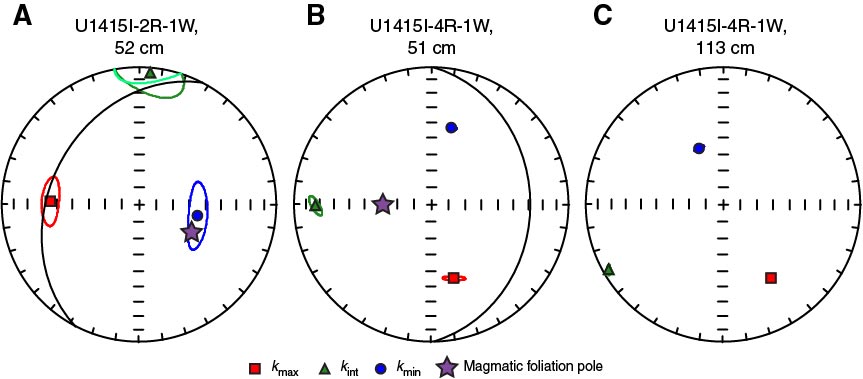
Figure F28. A–C. Anisotropy of low-field magnetic susceptibility data from three discrete samples in Hole U1415I. Projections show statistically distinct bootstrapped mean eigenvectors averaged from three measurements of each discrete sample. Red, green, and blue lines represent 95% bootstrapped confidence ellipses associated with the maximum, intermediate, and minimum eigenvectors, respectively. Great circles indicate the orientation of magmatic foliations determined from structural observations in the core.
Previous | Close | Next | Top of page