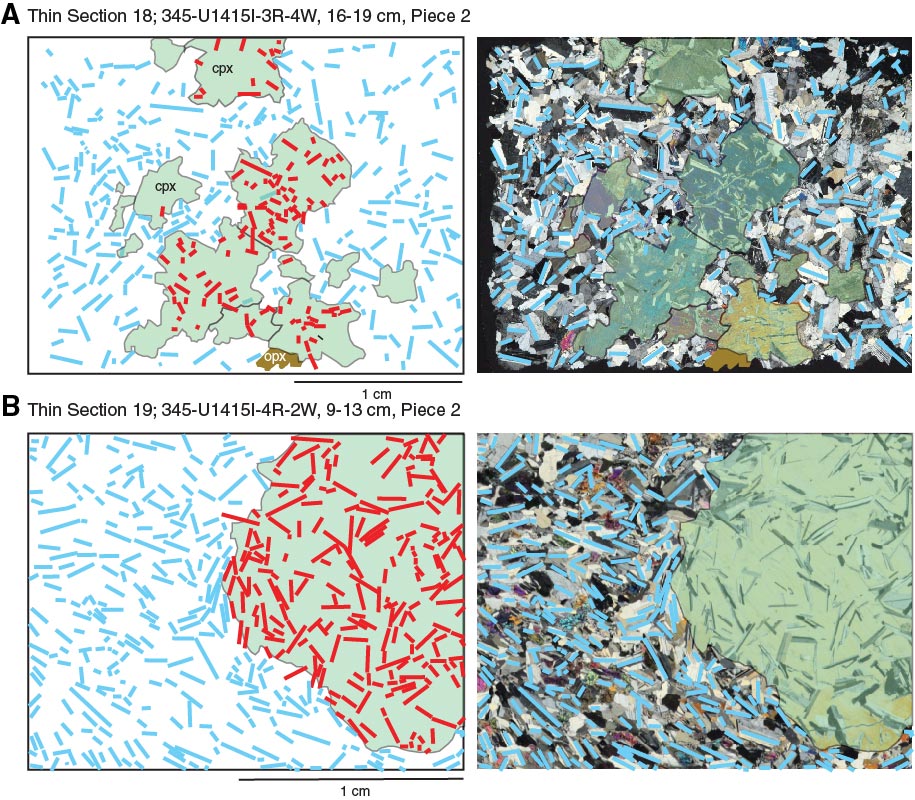
Figure F9. Images of qualitative estimation of crystal-preferred orientation of plagioclase crystals in clinopyroxene oikocrysts and corresponding matrix rock by manual outlining of the long axis of plagioclase for two different samples. Images on the left show the drawn outlines of elongated plagioclase; images on the right show the corresponding thin section microphotographs (under crossed polars). For details, see text. A. Gabbro matrix rock (Thin Section 18; Sample 345-U1415I-3R-4, 16–19 cm [Piece 2]). B. Troctolite matrix rock (Thin Section 19; Sample 345-U1415I-4R-2, 9–13 cm [Piece 2]).
Previous | Close | Next | Top of page