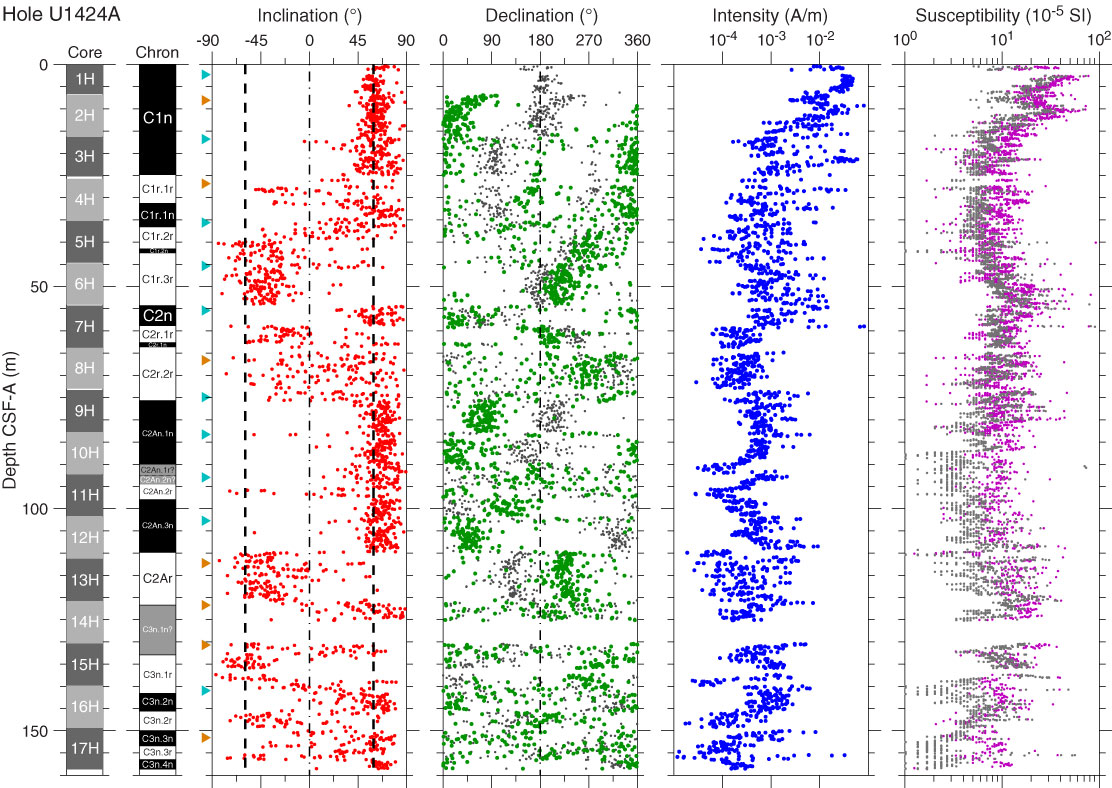
Figure F19. Paleomagnetism after 20 mT alternating field demagnetization, Hole U1424A. Chron column: black = normal polarity, white = reversed polarity, gray = zones or polarity boundaries without a clear magnetostratigraphic interpretation. Thin black dashed lines are the expected geocentric axial dipole inclinations at the site latitude during reversed (left) and normal (right) polarities. Triangles mark depth levels where discrete paleomagnetic cube samples were collected; orange triangles indicate discrete samples. Declination: gray circles = measured declination values, green circles = declination values corrected using core orientation data collected by the FlexIT tool. Susceptibility: magenta circles = Section Half Multisensor Logger values, gray circles = Whole-Round Multisensor Logger values.
Previous | Close | Next | Top of page