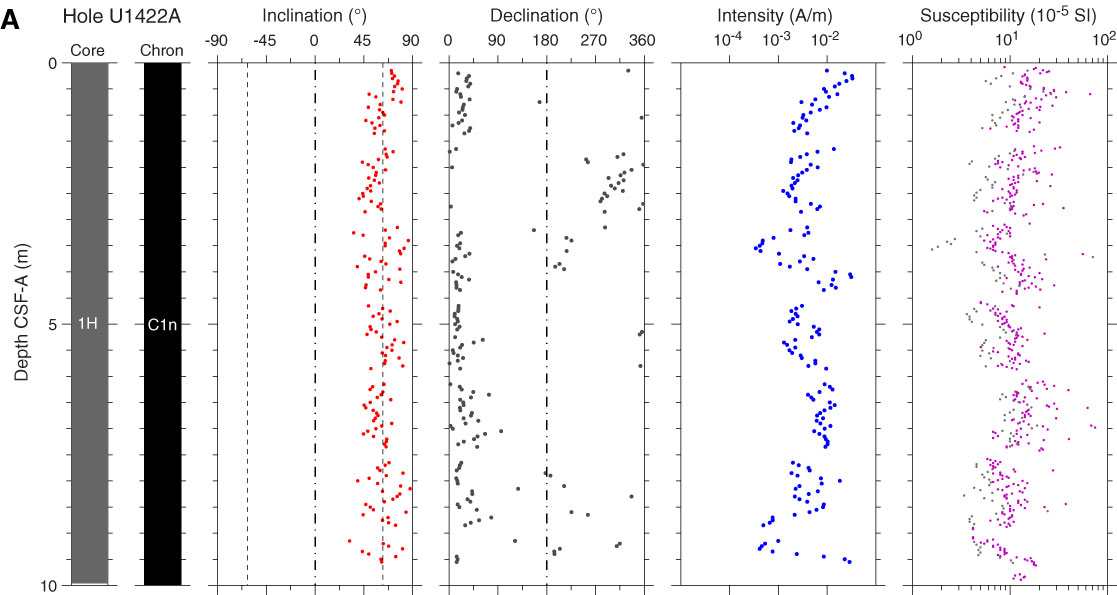
Figure F32. Paleomagnetism after 20 mT AF demagnetization, Site U1422. Chron column: black = normal polarity, white = reversed polarity, gray = zones or polarity boundaries without clear magnetostratigraphic interpretation. Inclination column: thin black dashed lines = expected geocentric axial dipole inclinations at the site latitude during reversed (left) and normal (right) polarities. Declination column: gray dots = measured declination values, green dots = declination values corrected using core orientation data collected by the FlexIT tool. Susceptibility column: SHMSL and WRMSL measured values are shown in magenta and gray dots, respectively. A. Hole U1422A. (Continued on next four pages.)
Previous | Close | Next | Top of page