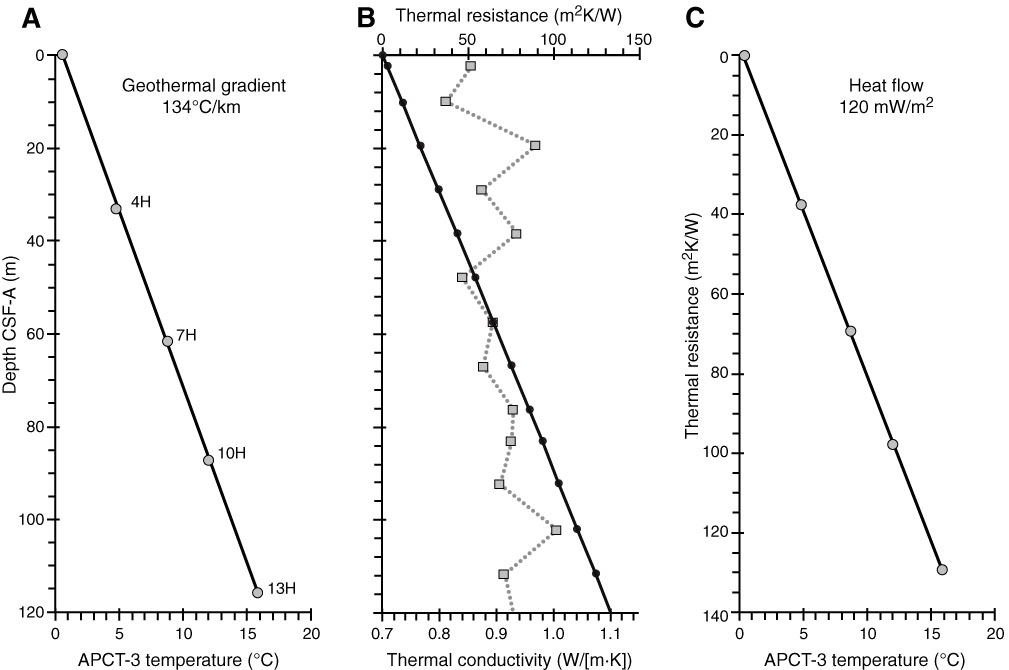
Figure F38. Plots of heat flow calculations, Hole U1422C. A. In situ sediment temperatures from advanced piston corer temperature tool (APCT-3) measurements with average values for Cores 346-U1422C-4H, 7H, 10H, and 13H (circles) and linear fit. B. In situ thermal conductivity data (squares) with calculated thermal resistance (solid line). C. Bullard plot of heat flow calculated from a linear fit of temperature vs. thermal resistance data.

Previous | Close | Next | Top of page