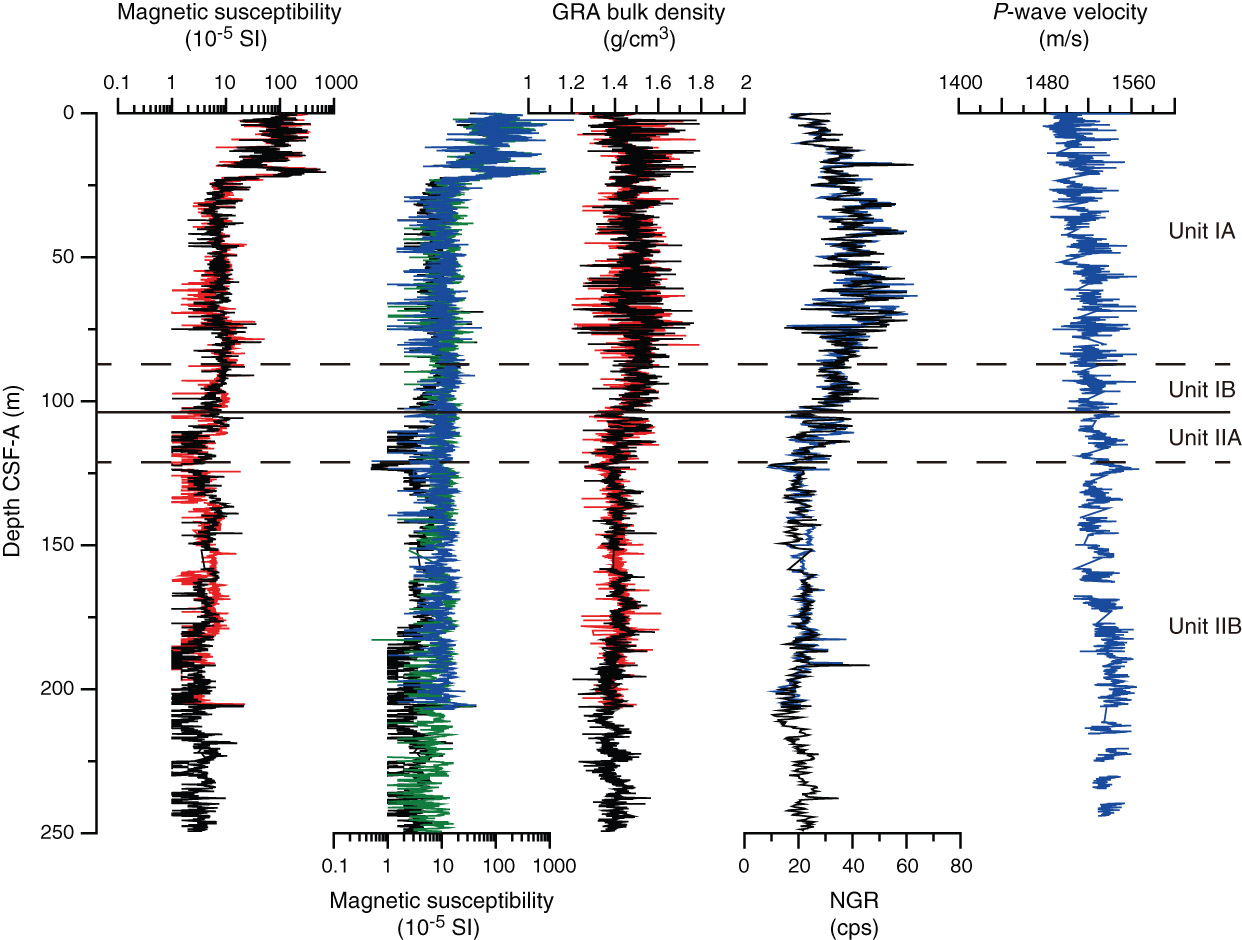
Figure F33. Suite of physical properties measured in Holes U1423A and U1423B. The first magnetic susceptibility panel shows WRMSL data of Holes U1423A (red) and U1423B (black), whereas the second panel shows WRSML data of Hole U1423B (black) and point SHMSL susceptibility data of Holes U1423A (blue) and U1423B (green). WRMSL gamma ray attenuation (GRA) bulk density is from Holes U1423A (red) and U1423B (black). Natural gamma radiation (NGR) is from in Holes U1423A (light blue) and U1423B (black). P-wave velocity panel shows combined WRMSL data of Holes U1423A and U1423B. Dashed horizontal lines = lithologic subunit boundaries, solid horizontal line = lithologic Unit I/II boundary.
Previous | Close | Next | Top of page