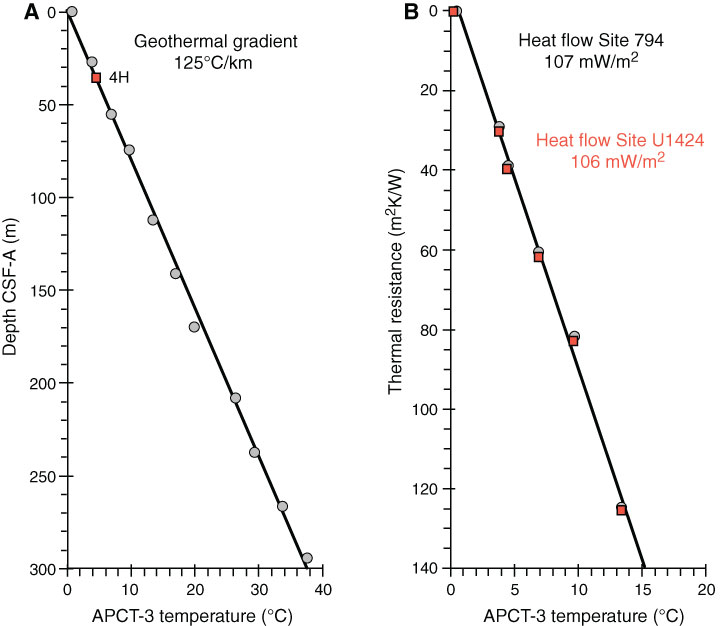
Figure F41. A. Hole U1424A in situ sediment temperature from advanced piston corer temperature tool (APCT-3) measurement for Core 346-U1424A-4H (red square) plotted among in situ sediment temperatures measured at the same location during Leg 127 (Site 794). Black line shows linear fit. B. Bullard plot of heat flow calculated from a linear fit of temperature vs. thermal resistance data. In situ thermal resistances are derived from Site 794 (circles) and U1424 (squares) thermal conductivity laboratory measurements.
Previous | Close | Next | Top of page