Previous | Close | Next
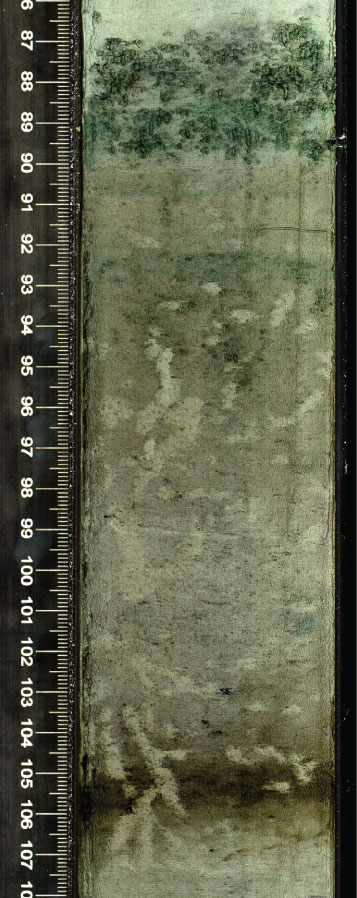
Figure F12. Detail of heavy bioturbation near the top of Subunit IA (interval 346-U1425B-1H-5, 86–107 cm). Note core images have been enhanced using a color contrast to highlight sedimentary structures.
Previous | Close | Next | Top of page