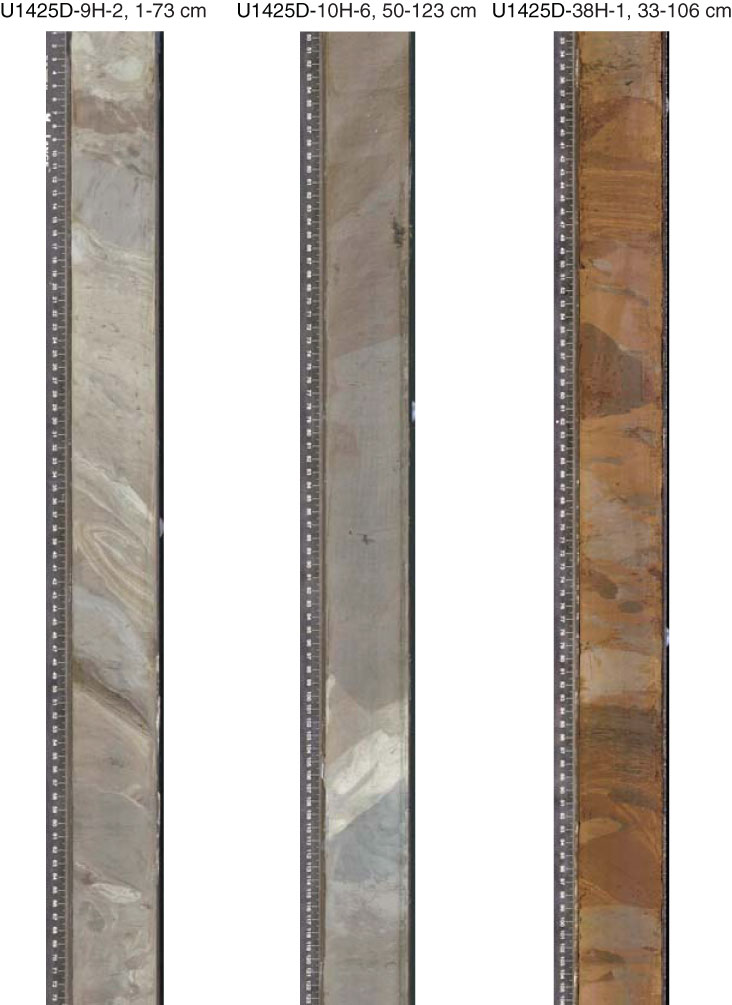
Figure F19. Photographs of slump folds at the Unit I/II boundary (Cores 346-U1425D-9H and 10H) and in Subunit IIIA (Core 38H). Note core images have been enhanced using a color contrast to highlight sedimentary structures.
Previous | Close | Next | Top of page