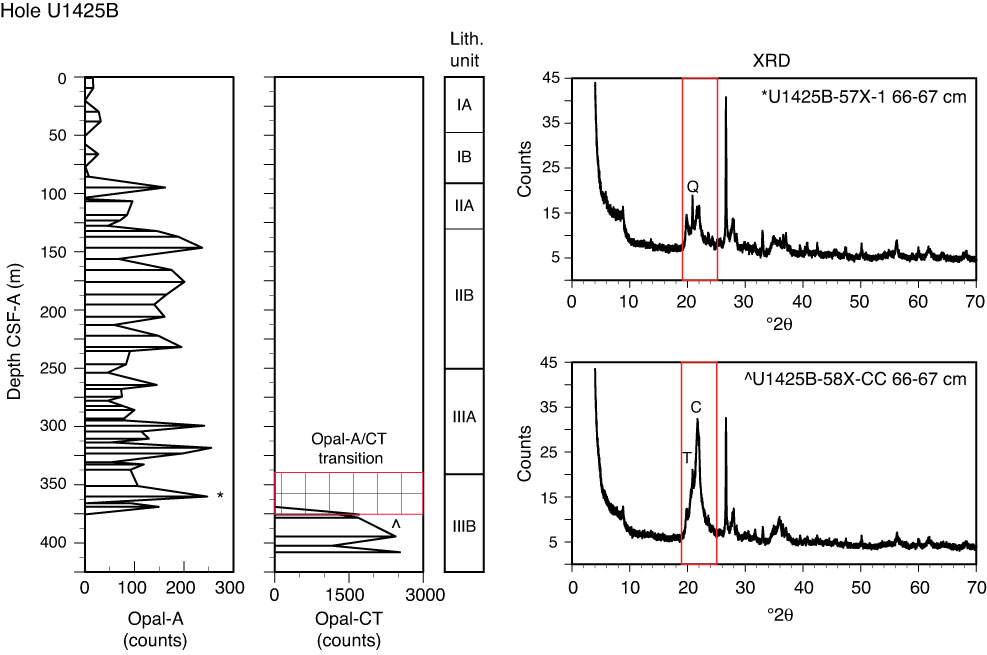
Figure F22. Downcore variations in opal-A and opal-CT with a switch between the two occurring at ~378 m CSF-A. X-ray diffraction (XRD) diagrams highlight well-defined peaks of cristobalite (C) and tridymite (T) in the lower section of Subunit IIIB, whereas there is only a clear peak in quartz (Q) in the upper portion of Subunit IIIB.
Previous | Close | Next | Top of page