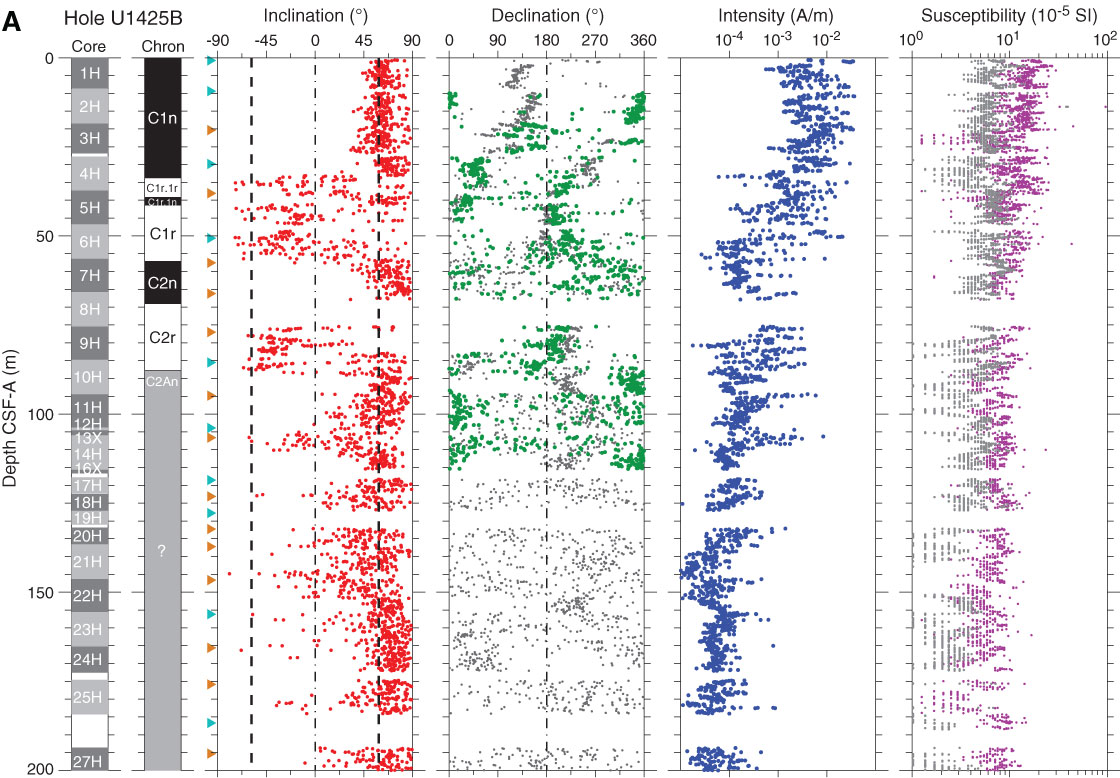
Figure F53. Paleomagnetism after 20 mT AF demagnetization, Site U1425. Chron column: black = normal polarity, white = reversed polarity, gray = zones or polarity boundaries without clear magnetostratigraphic interpretation. Inclination column: thin black dashed lines = expected geocentric axial dipole inclinations at the site latitude during reversed (left) and normal (right) polarities, triangles along the left side mark depths where discrete paleomagnetic cube samples were collected (orange = discrete samples measured during the expedition). Declination column: gray dots = measured declination values, green dots = declination values corrected using core orientation data collected by the FlexIT tool. Susceptibility column: SHMSL and WRMSL measured values are shown in magenta and gray dots, respectively. A. Hole U1425B shallower than 200 m CSF-A. (Continued on next three pages.)
Previous | Close | Next | Top of page