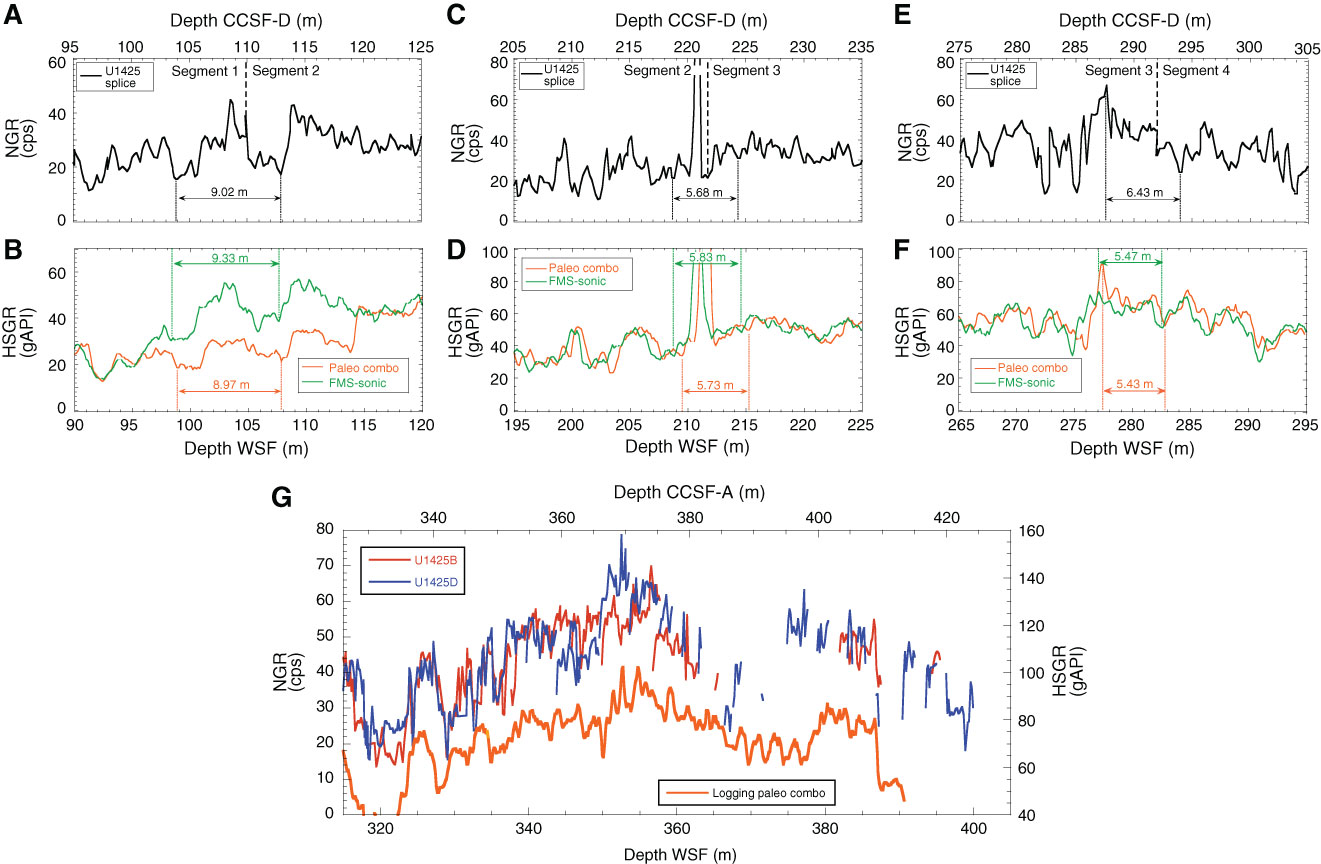
Figure F66. A–G. Correlation between core splice NGR and downhole logging total spectral gamma ray (HSGR) logs (green and orange curves) around the intervals between splice Segment 1/2, 2/3, and 3/4 boundaries and Segment 5. Distances between correlative horizons above and below segment boundaries are also shown. FMS = Formation MicroScanner. In B, between 96 and 114 m WSF, the HSGR data from the paleo combo tool string artificially deviate from the FMS-sonic tool string HSGR data to lower values as a result of the paleo combo caliper closure at ~114 m WSF (see “Downhole measurements”).
Previous | Close | Next | Top of page