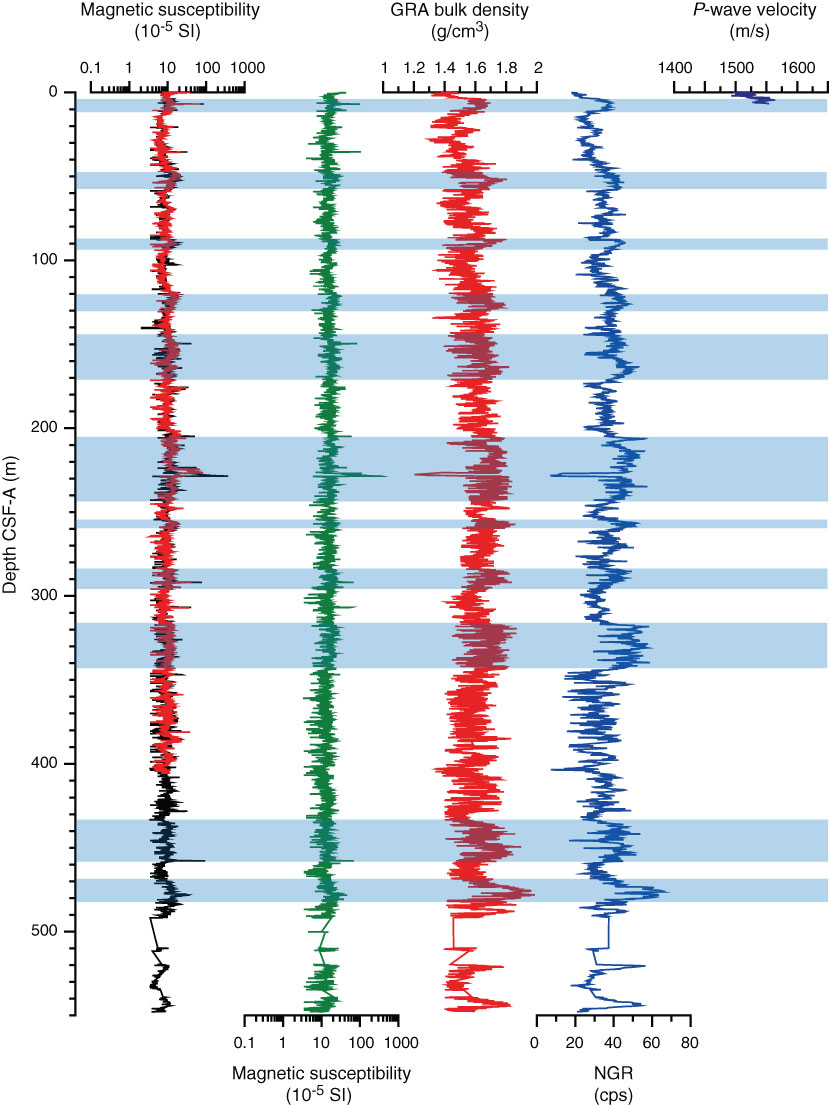
Figure F46. Suite of physical properties measured in Holes U1427A and U1427B. The first magnetic susceptibility panel shows WRMSL data of Hole U1427A (black) and U1427B (red), whereas the second panel shows point SHMSL susceptibility data of Hole U1427A. Gamma ray attenuation (GRA) bulk density is from Hole U1427A. Natural gamma radiation (NGR) counts are from Hole U1427A. P-wave velocity panel shows combined data from WRMSL of Holes U1427A and U1427B. Shaded blue areas indicate clay-rich sediment interval and remains are biogenic component–rich sediment intervals.
Previous | Close | Next | Top of page