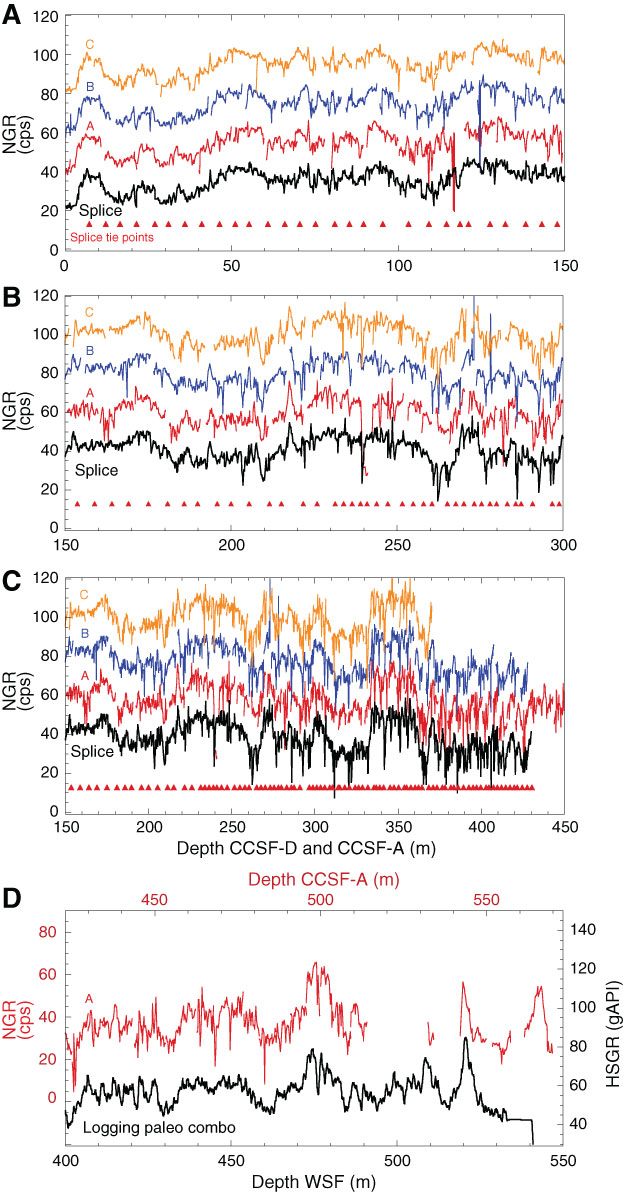
Figure F56. A–C. Alignment of all the cores from Holes U1427A (red), U1427B (blue), and U1427C (orange) illustrated using natural gamma radiation (NGR) profiles. The spliced profile is also shown (black). Splice tie points are indicated by red solid triangles. D. For the interval deeper than 430.34 m CCSF-A, NGR from Hole U1427A (red) is compared with total spectral gamma ray (HSGR) from paleo combo log (black).
Previous | Close | Next | Top of page