Previous | Close | Next
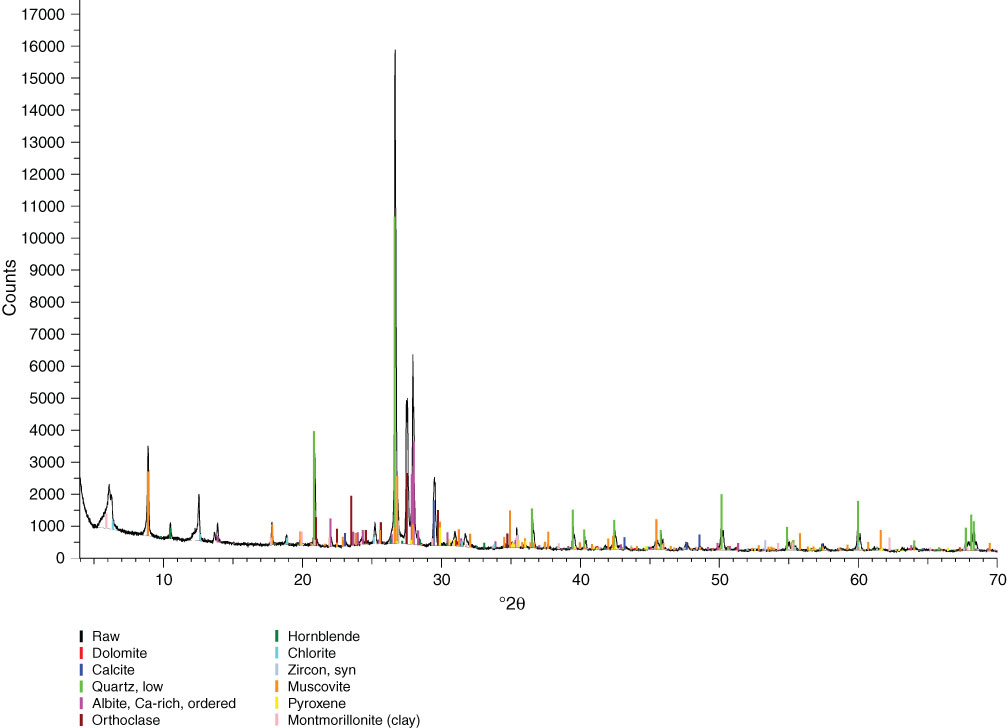
Figure F17. X-ray diffractogram of a representative sand from Unit B (Sample 346-U1428A-32H-2, 10 cm; 208.24 m CSF-A).
Previous | Close | Next | Top of page