Previous | Close | Next
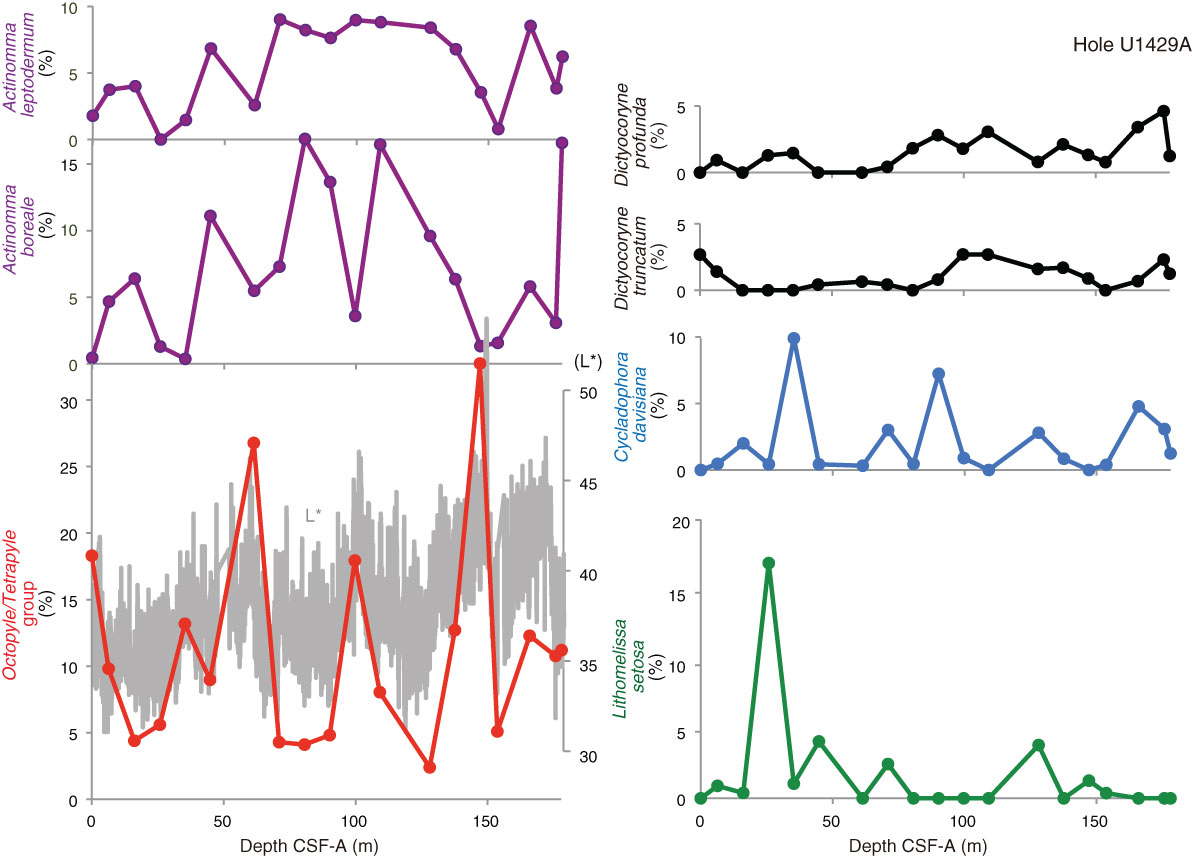
Figure F22. Relative abundance changes of seven most abundant radiolarian groups (% of total assemblage) in Hole U1429A. Variations in color reflectance L* value are shown in the lowest panel (gray line).
Previous | Close | Next | Top of page