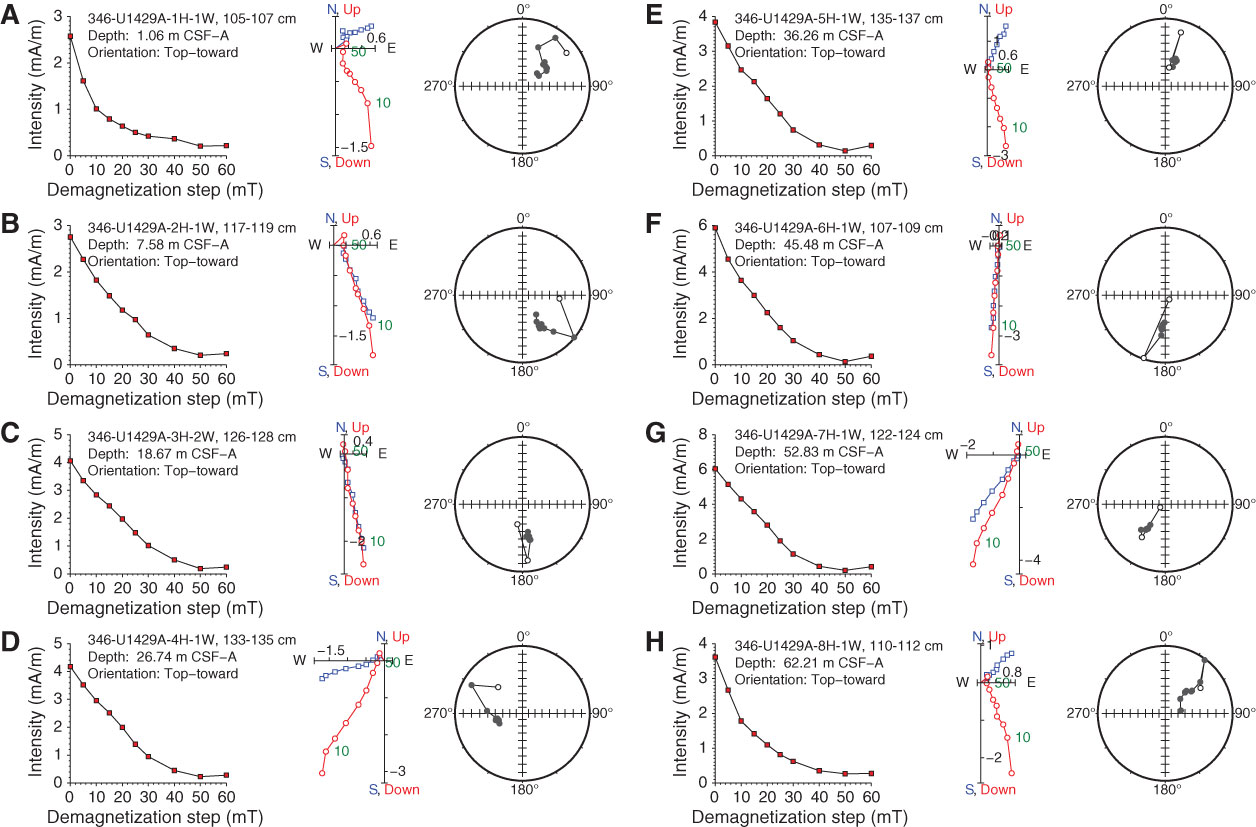
Figure F49. AF demagnetization results for discrete samples, Hole U1429A. For each sample, the left plot shows the intensity variation with progressive demagnetization. The middle and right plots show the NRM vector measured after each demagnetization treatment on an orthogonal projection (Zijderveld) and on an equal area projection respectively. In the orthogonal projection plot, squares = horizontal projections, circles = vertical projections. In the equal area projection plot, closed circles = projection data with positive inclinations, and open circles = projection data with negative inclinations. Note that on the orthogonal projection (Zijderveld) plot, NRM data before demagnetization have been removed to better display the demagnetized data. A–H. Discrete cube samples from 62.21 m CSF-A and shallower. (Continued on next two pages.)
Previous | Close | Next | Top of page