Previous | Close | Next
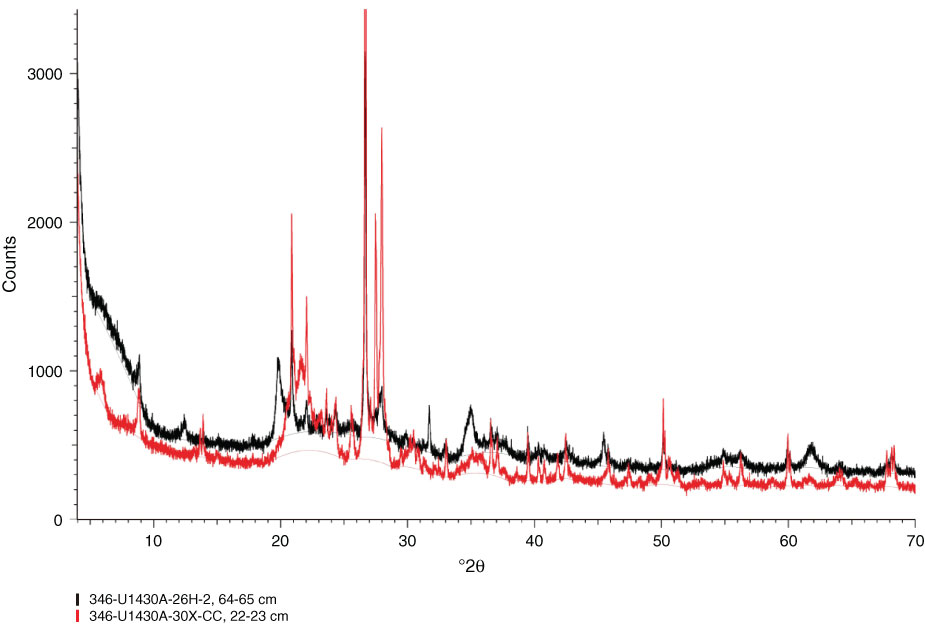
Figure F17. Comparison of XRD diffractogram of two samples (346-U1430A-28H-2A, 64–65 cm, and 30X-CC, 22–23 cm). Note that a typical opal-CT signature appears in the deeper-depth sample.
Previous | Close | Next | Top of page