Previous | Close | Next
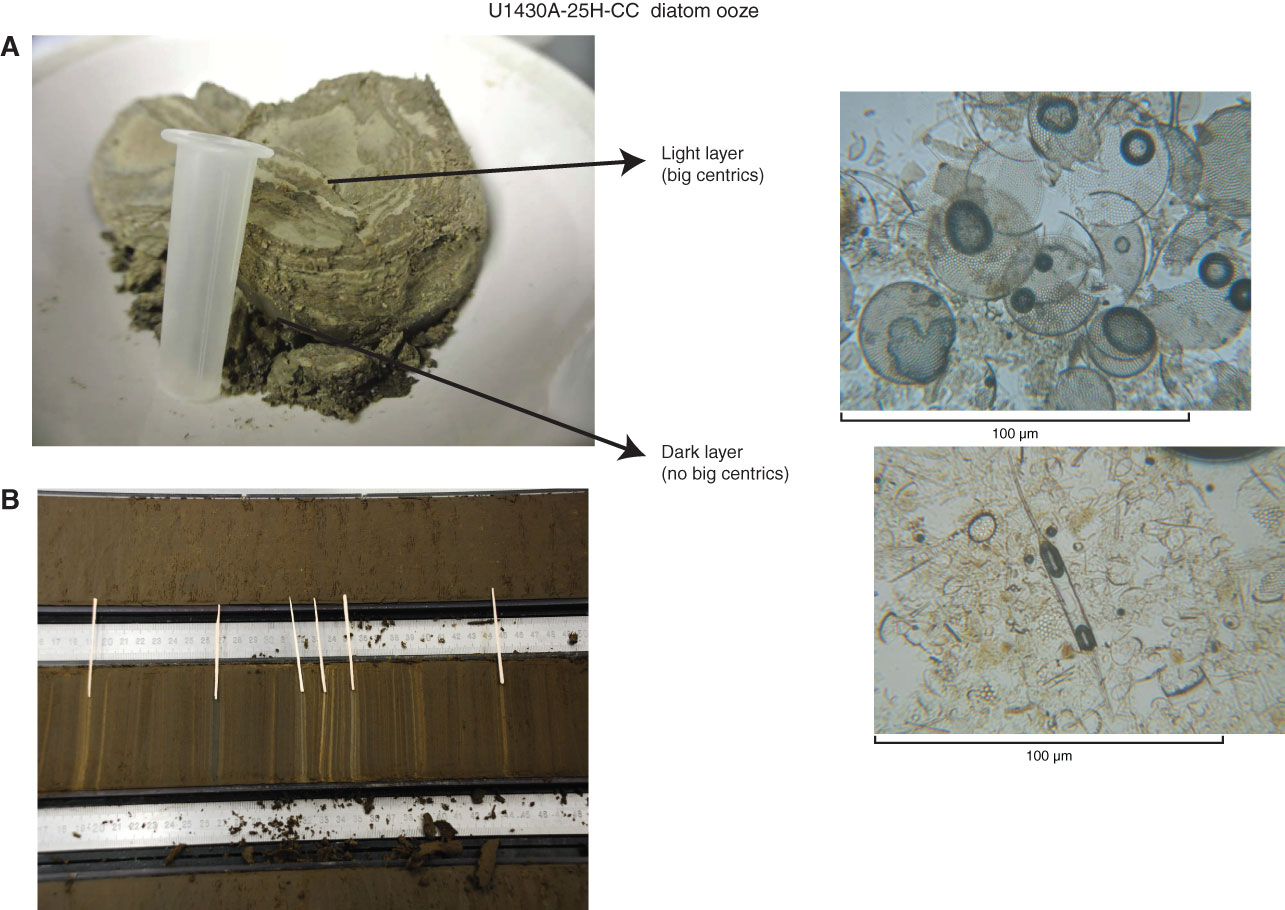
Figure F29. Dark and light diatom ooze laminations in (A) Sample 346-U1430A-25H-CC and (B) Core U1430A-25H (toothpicks point to sampled intervals).
Previous | Close | Next | Top of page