Previous | Close | Next
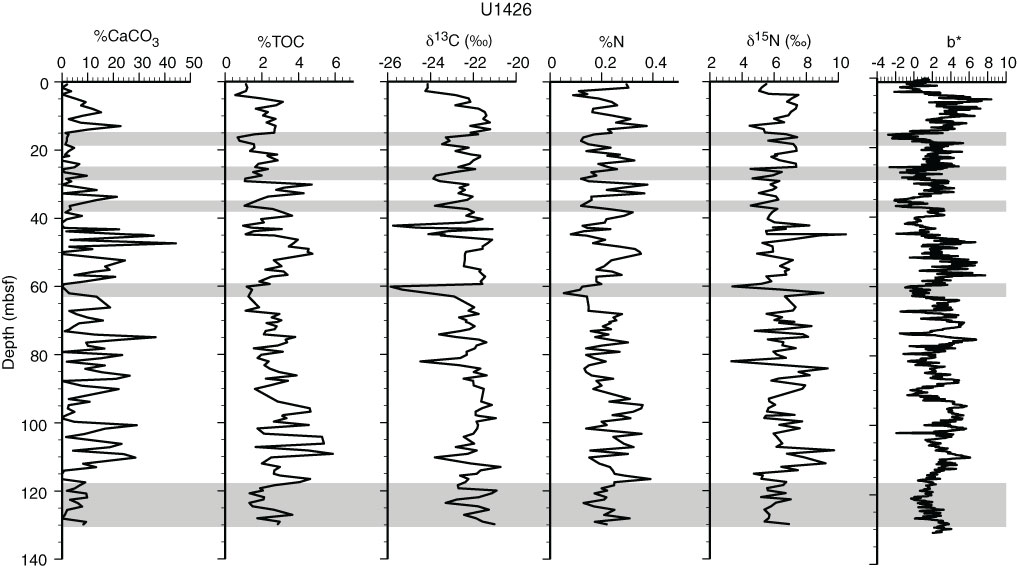
Figure F2. Calcium carbonate (%CaCO3), total organic carbon (%TOC), total nitrogen (%N), δ13C, and δ15N content of sediment samples and b* data, Site U1426. Shaded regions represent glacial periods.
Previous | Close | Next | Top of page