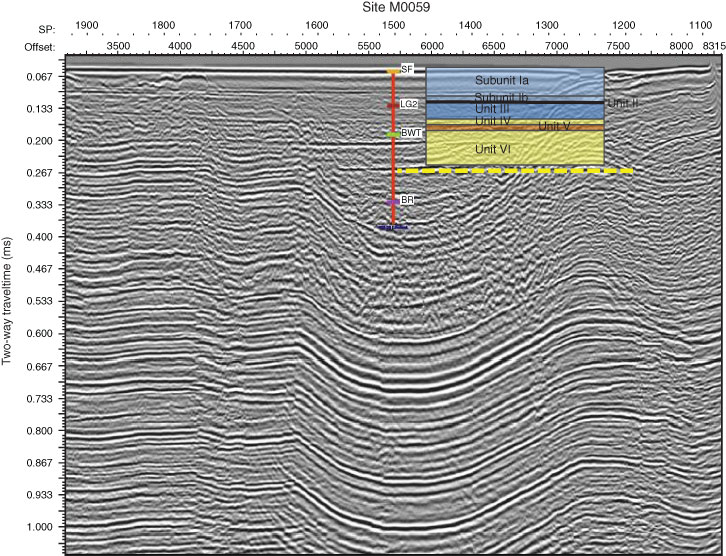
Figure F32. Correlation of seismic profile with lithostratigraphic units/boundaries, Site M0059. Dashed yellow line = bedrock surface calculated by velocities from core data. Precruise interpretation of seismic data is also shown: SF = seafloor, LG2 = lower boundary of late-glacial clays, BWT = bottom of Weichselian till, BR = bedrock. Seismic profile source: V. Spiess, 2013 (unpubl. data).
Previous | Close | Next | Top of page