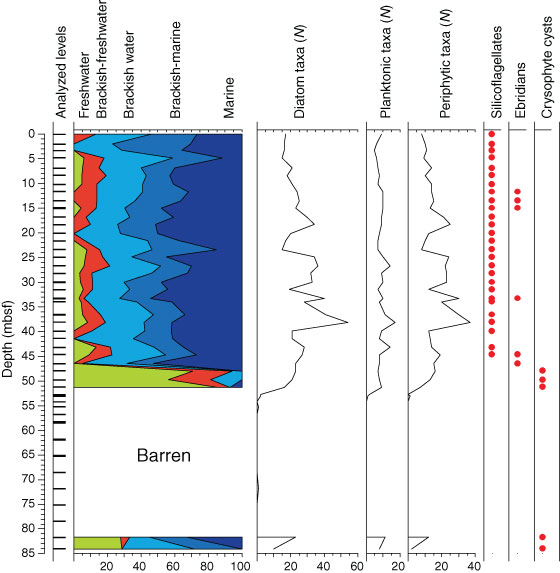
Figure F5. Analyzed levels and the proportion of diatom taxa showing different salinity affinities, Hole M0059A. The total number of diatom taxa recorded is plotted, as well as the number of taxa associated with planktonic and periphytic life forms. Red dots = other siliceous microfossils recorded in the cores.
Previous | Close | Next | Top of page