Previous | Close | Next
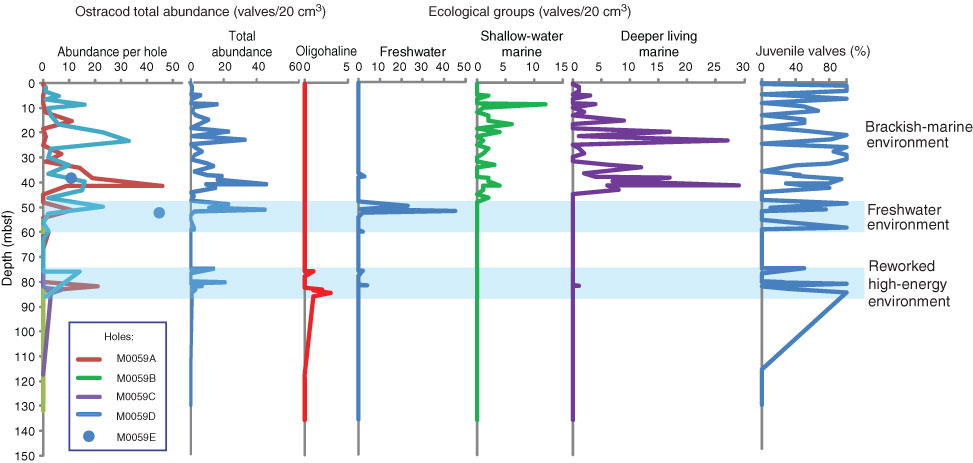
Figure F8. Plots of ostracod total abundance and ecological group distribution, Site M0059. Abundance is shown per sediment volume.
Previous | Close | Next | Top of page