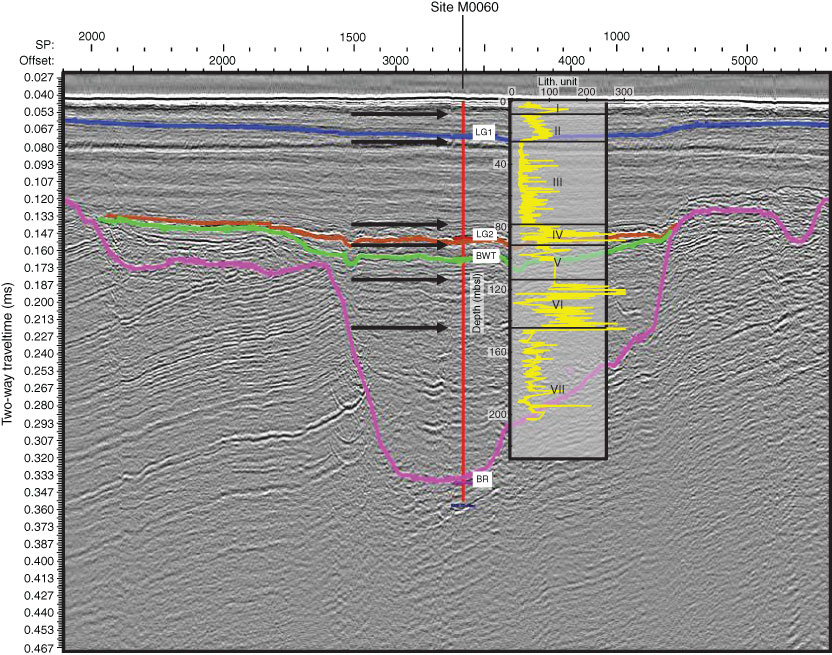
Figure F22. Correlation of the seismic profile with lithologic boundaries and multisensor core logger magnetic susceptibility data. Black arrows = unit boundaries. Precruise interpretation of seismic data is also shown: LG1 = bottom of late glacial Unit I, LG2 = lower boundary of late-glacial clays, BWT = bottom of Weichselian till, BR = bedrock. Seismic profile source: V. Spiess, 2013 (unpubl. data).

Previous | Close | Next | Top of page