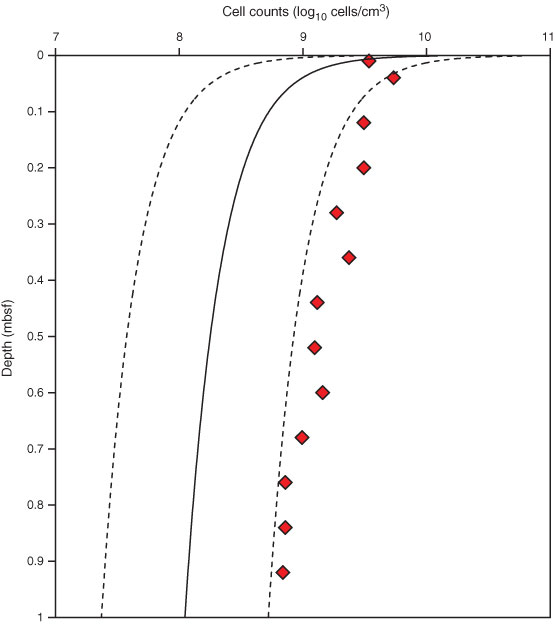
Figure F20. Plot of microbial cell abundance (red diamonds), Hole M0061K. Solid black line = global regression line of prokaryote cell numbers with depth, dashed lines = upper and lower 95% prediction limits for regression line (Roussel et al., 2008).
Previous | Close | Next | Top of page