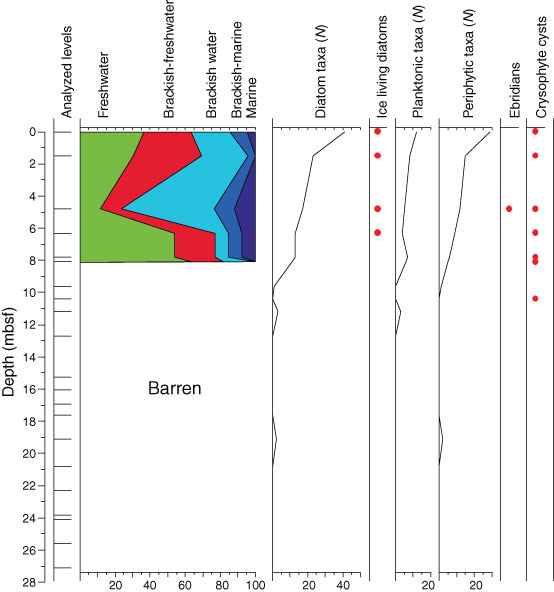
Figure F3. Analyzed levels of siliceous microfossils and the proportion of diatom taxa showing different salinity affinities, Site M0061. The total number of diatom taxa recorded is plotted, as well as the number of taxa associated with planktonic, periphytic, and sea ice related taxa. Red dots indicate presence of sea ice related taxa and other siliceous microfossils recorded in the cores. This graph must be interpreted with caution because it is based only on qualitative analyses. Each species was counted only present or absent, so a species represented by a single valve carries as much weight as a species dominating the assemblage.

Previous | Close | Next | Top of page