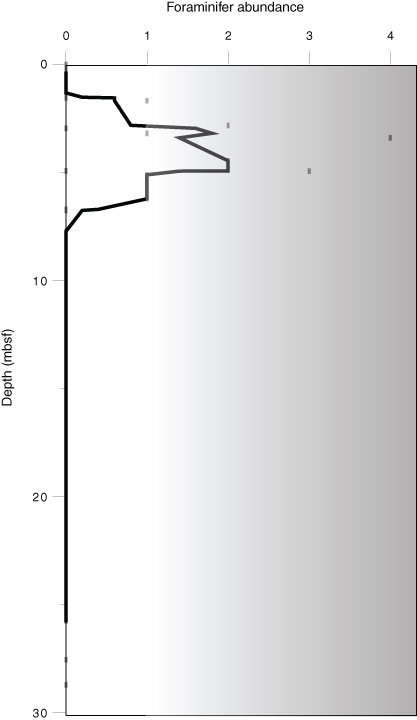
Figure F5. Abundance of benthic foraminifers based on the abundance classification defined in the “Methods” chapter (Andrén et al., 2015a), Site M0061. A running average over three samples is plotted onto single data points. Increasing shading indicates abundances sufficient for faunal and/or geochemical analyses.
Previous | Close | Next | Top of page