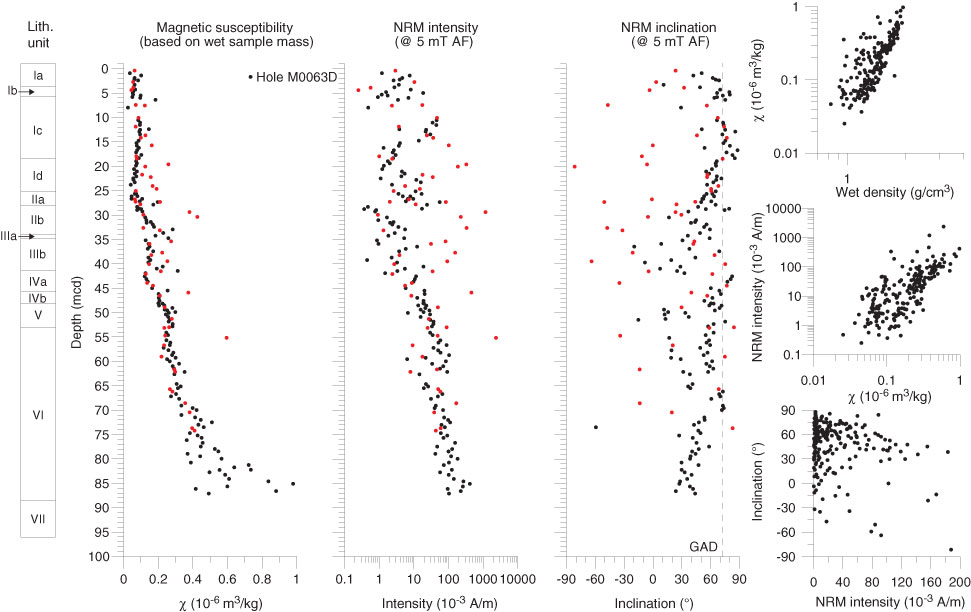
Figure F21. Plots and biplots of magnetic susceptibility (χ), natural remanent magnetization (NRM) intensity, and NRM inclination of discrete paleomagnetic samples, Hole M0063D. Dashed line = geocentric axial dipole (GAD) prediction of inclination for the site latitude. Red dots = samples from the upper 0.75 m of each core run that showed signs of contamination by rust. AF = alternating field.
Previous | Close | Next | Top of page